
If you're exploring a career in analytics, you've probably come across two job titles that sound almost identical: Data Analyst and Business Analyst.
At first glance, they seem interchangeable. Both work with data, support decision-making, and are highly valued across industries. So how do you choose?
The confusion is understandable. Employers often use these titles interchangeably, and in smaller organisations, one person may handle both roles. As a result, many beginners feel stuck; unsure which course to take or which path to pursue.
Here's the good news: you don't need to have your entire career mapped out before starting. By building a strong foundation in analytics, you'll develop transferable skills that keep your options open, helping you explore different paths as your confidence grows.
Whether you're a student, fresh graduate, or working professional, understanding the difference between data analysts and business analysts will help you choose the direction that fits your strengths.
In this beginner-friendly guide, we'll explain what each role does, highlight the key differences, explore the skills you'll need, and show how a foundational analytics course can set you up for success.
Key Takeaways
- Data analysts focus on collecting, organising, analysing, and presenting data.
- Business analysts focus on improving processes and helping organisations make better decisions.
- Both careers require analytical thinking but use different skill sets.
- Foundational skills come first; specialisation can come later.
- Your interests and strengths matter more than choosing the "popular" title.
Let's dive in.
Why Data Analyst and Business Analyst Get Confused
At first glance, the two roles appear almost identical. Both work with information, solve problems, prepare reports, and support decision-making. They also collaborate with different departments and help organisations improve performance.
This overlap explains why many people assume the jobs are interchangeable.
For example:
A retail company wants to understand why sales have declined in one region.
A data analyst may analyse transaction records, customer behaviour, and historical sales data to identify patterns behind the decline.
A business analyst, on the other hand, works with sales managers, operations teams, and senior management to understand broader business challenges, identify process gaps, and recommend practical solutions based on those findings.
Although both professionals contribute to solving the same business problem, they approach it from different perspectives.
Why Job Titles Differ Between Companies
One reason for the confusion is that there is no universal definition for either role.
Large organisations usually have dedicated teams with clearly defined responsibilities. Data analysts concentrate on analysing information, while business analysts focus on improving workflows, gathering requirements, and supporting business change.
Smaller businesses often have fewer resources, meaning one person may be expected to prepare reports, analyse data, meet stakeholders, and recommend improvements.
This is particularly common among small and medium-sized enterprises (SMEs) in Singapore, where employees frequently wear multiple hats to support business growth.
As a result, two companies advertising the same job title may expect very different responsibilities.
When comparing courses or career paths, it is therefore more useful to understand what the role actually involves than to focus solely on the job title.
The Overlap Is Real, but the Focus Is Different
Think of it this way:
A data analyst asks:
"What is the data telling us?"
A business analyst asks:
"Given what we've learned, what should the business do next?"
This simple distinction captures the essence of each role.
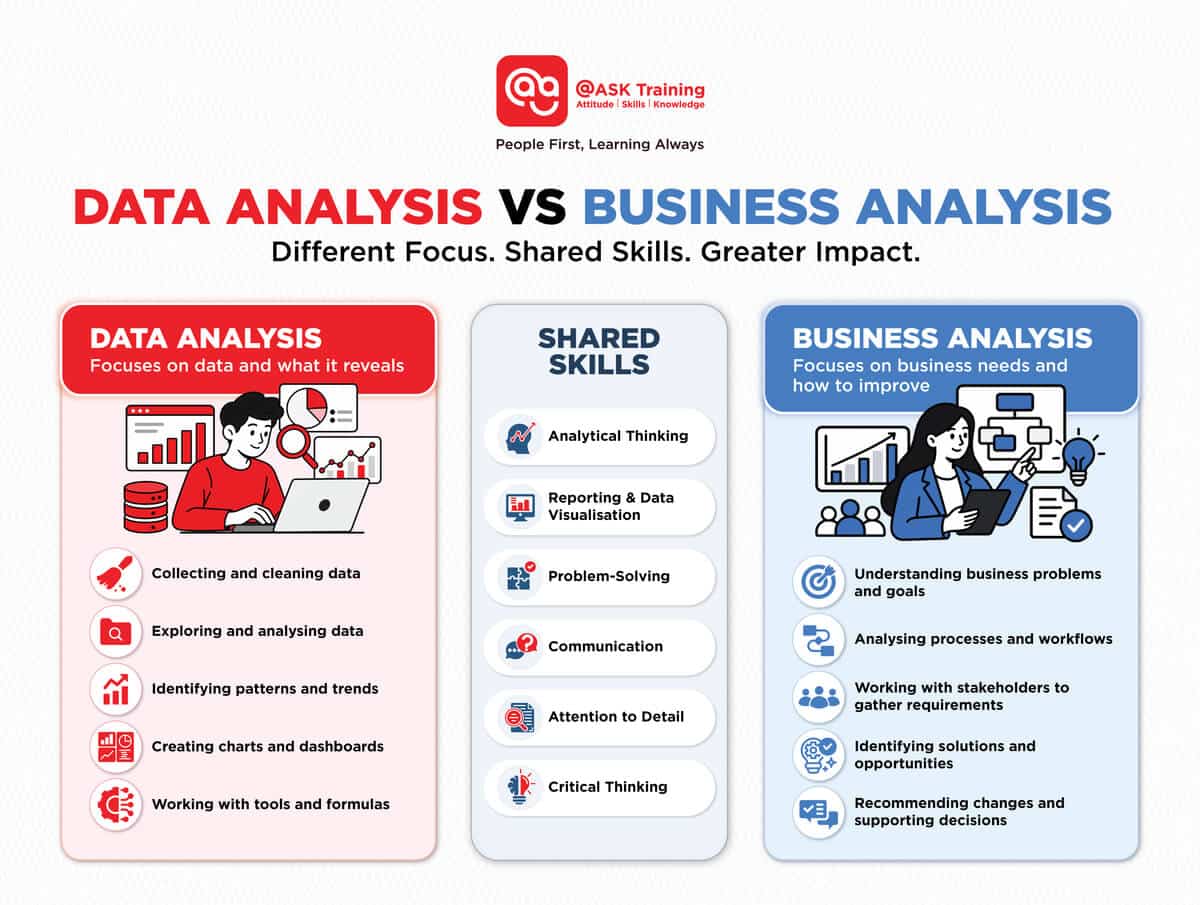
Data analysts spend more time working directly with datasets, reports, dashboards, and trends.
Business analysts spend more time understanding business objectives, identifying operational issues, and helping teams implement improvements.
Both roles are valuable, and many successful projects rely on close collaboration between them.
Here's a quick visual comparison showing what each role focuses on, and the shared skills that make both valuable to organisations:
Now that we've clarified why these roles are often confused, let's take a closer look at what each one actually does on a day-to-day basis.
What Does a Data Analyst Actually Do?
Imagine a supermarket wants to know which products sell best during festive seasons.
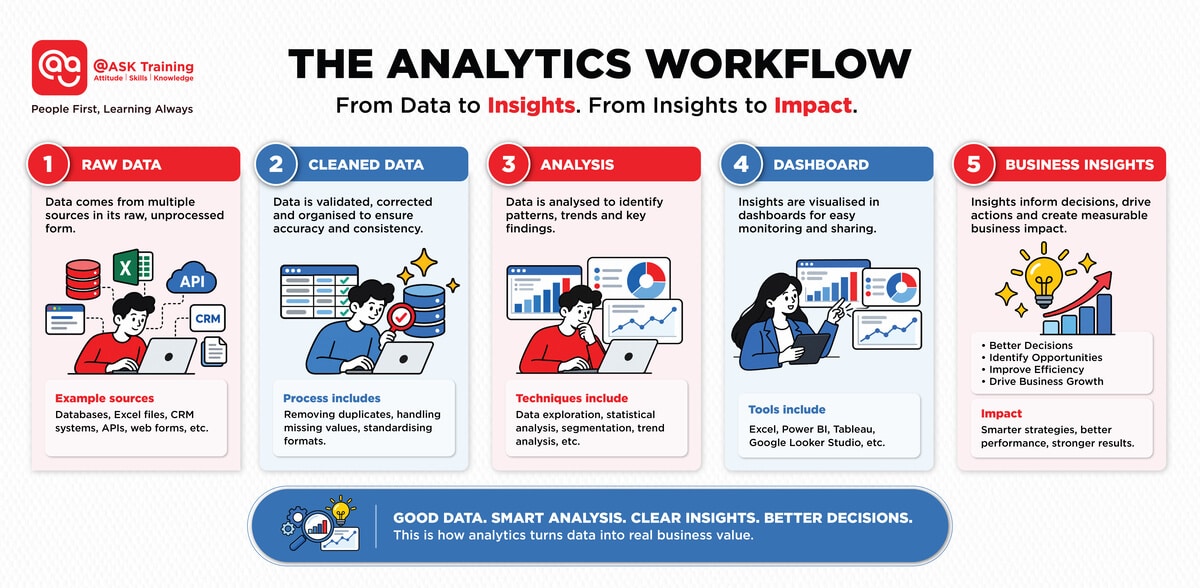
A data analyst gathers sales records, cleans the data to remove errors or duplicates, analyses purchasing trends, and presents the findings through dashboards or reports.
The insights help managers decide which products to stock, when to launch promotions, and how to forecast demand more accurately.
Rather than making business decisions themselves, data analysts provide reliable evidence that allows decision-makers to act with confidence.
Across industries such as retail, healthcare, finance, manufacturing, and logistics, organisations increasingly rely on data analysts to transform large volumes of information into actionable insights.
Common Responsibilities of a Data Analyst
Although responsibilities vary between organisations, data analysts commonly:
- Collect data from multiple sources.
- Clean and organise datasets.
- Analyse trends and patterns.
- Create charts and visualisations.
- Build dashboards for stakeholders.
- Prepare regular performance reports.
- Monitor key business metrics.
- Present findings clearly to non-technical audiences.
For example:
A logistics company might ask a data analyst to investigate why delivery times have increased over the past six months.
By analysing delivery records, warehouse operations, and route data, the analyst can identify patterns that may not be immediately obvious, enabling managers to make informed operational improvements.
Tools Commonly Used by Data Analysts
Beginners often worry that becoming a data analyst requires advanced programming knowledge from day one.
Fortunately, this isn't the case.
Many entry-level roles begin with familiar tools such as Microsoft Excel before gradually introducing more specialised software.
Common tools include:
- Microsoft Excel: For organising, cleaning, and analysing data.
- SQL (Structured Query Language): For retrieving and managing data stored in databases.
- Microsoft Power BI: For creating interactive dashboards and visualising business data.
- Tableau: Another popular data visualisation tool used to build reports and dashboards.
- Python: A programming language used for more advanced data analysis, automation, and machine learning.
Learning these tools gradually helps learners build confidence while developing practical skills that employers value.
Many beginners choose a structured Data Analyst course programme because it introduces these tools in a logical sequence, starting with spreadsheets and reporting before progressing to dashboard creation and data visualisation.
Do You Need to Be a Programmer?
One of the biggest misconceptions about data analytics is that every data analyst must be an expert programmer.
In reality, the level of technical knowledge depends on the role.
Many junior positions focus on organising data, creating reports, building dashboards, and communicating insights. Strong Excel skills, logical thinking, and attention to detail are often more important than writing complex code.
As your career develops, you may choose to learn additional tools such as SQL or Python to work with larger datasets or automate repetitive tasks. However, beginners are usually better served by mastering the fundamentals before moving on to more advanced technologies.
The goal isn't to learn every analytics tool at once. It's to build confidence in understanding data and using it to answer meaningful business questions.
Here's a simple guide to the data analyst's workflow, from collecting data to creating reports that drive business decisions:
While data analysts spend most of their time working directly with numbers and dashboards, the business analyst role takes a different approach.
What Does a Business Analyst Actually Do?
Unlike data analysts, who spend much of their time working with data, business analysts focus on understanding business needs and identifying opportunities for improvement.
Their goal is to help organisations solve problems, streamline processes, and make informed business decisions.
Rather than asking, "What does the data tell us?", business analysts ask, "How can the business perform better?"
While they may use data to support their recommendations, their role extends beyond analysing numbers.
They spend considerable time working with stakeholders, understanding business objectives, documenting requirements, and ensuring that proposed solutions align with organisational goals.
Understanding Business Problems Before Proposing Solutions
Imagine a bank receives frequent customer complaints about its online account opening process. Instead of immediately looking at the data, a business analyst first meets with different teams to understand how the process currently works.
They may interview customer service representatives, operations staff, compliance teams, and IT personnel to identify pain points.
Once the issues have been identified, they recommend improvements that make the process faster, simpler, and more efficient for customers.
In this example, data helps support the recommendations, but understanding the business problem comes first.
Common Responsibilities of a Business Analyst
Although responsibilities vary across organisations, business analysts commonly:
- Gather and document business requirements.
- Meet with stakeholders to understand their needs.
- Analyse existing business processes.
- Identify operational gaps and inefficiencies.
- Recommend process improvements.
- Support system implementation and business change.
- Evaluate whether proposed solutions achieve the desired outcomes.
Communication is a key part of the role. Business analysts regularly bridge the gap between business teams and technical teams, ensuring everyone shares a common understanding of project goals.
Tools Commonly Used by Business Analysts
Business analysts use a combination of documentation, collaboration, and reporting tools.
Common tools include:
- Microsoft Excel – for organising and analysing business data.
- Microsoft Visio – for mapping business processes and workflows.
- Microsoft Power BI – for visualising data and monitoring performance.
- Jira or Trello – for managing projects and tracking requirements.
- Microsoft Word and PowerPoint – for documenting requirements and presenting recommendations.
Learners interested in a Business Analyst course often begin by developing these practical skills before progressing to more specialised areas such as business process modelling, stakeholder management, or digital transformation.
Technical Skills Matter but So Do People Skills
Unlike many technical roles, business analysis relies heavily on communication.
Business analysts frequently facilitate discussions, ask questions, negotiate priorities, and present recommendations to different stakeholders. They need to understand both business objectives and technical possibilities while balancing the needs of multiple teams.
If you enjoy solving problems through collaboration, communication, and strategic thinking, business analysis could be an excellent fit.
By now, you can see that while both roles are valuable, they operate in very different ways.
To make the choice even clearer, let's directly compare the two side by side, so you can see exactly where the focus lies for each role.
The Main Difference: Data Focus vs Business Focus
Although both careers contribute to better decision-making, they approach problems from different angles.
The simplest way to remember the difference is this:
A Data Analyst asks:
"What does the data show?"
A Business Analyst asks:
"What should the business do about it?"
Neither role is more important than the other. In fact, they often work together on the same projects.
For example:
A hospital wants to reduce patient waiting times.
A data analyst examines appointment schedules, patient flow, and waiting time data to identify bottlenecks and trends.
A business analyst works with doctors, nurses, and administrative teams to understand the current workflow, identify inefficiencies, and recommend process improvements that reduce waiting times and improve the patient experience.
Comparing the Two Roles
| Data Analyst | Business Analyst |
| Focuses on analysing data | Focuses on solving business problems |
| Works mainly with datasets and reports | Works mainly with stakeholders and business processes |
| Identifies patterns and trends | Recommends business improvements |
| Creates dashboards and visualisations | Documents requirements and process changes |
| Uses Excel, SQL, Power BI, Tableau and Python | Uses Excel, Power BI, Visio and project management tools |
| Answers: "What happened?" | Answers: "What should we do next?" |
| Strong analytical and technical skills | Strong communication and problem-solving skills |
| Produces reports and dashboards | Produces business recommendations and process documentation |
Which Path Fits Your Strengths?
Choosing between the two roles isn't about selecting the "better" career. It's about choosing the one that aligns with your interests, strengths, and preferred way of working.
Data Analytics May Suit You If You...
You may enjoy data analytics if you like:
- Working with numbers and spreadsheets.
- Finding patterns and trends.
- Creating dashboards and reports.
- Solving technical problems.
- Turning raw data into meaningful insights.
If these activities sound appealing, you may benefit from exploring a data analyst vs business analyst course comparison before deciding which learning pathway best matches your goals.
Business Analysis May Suit You If You...
Business analysis could be a better fit if you enjoy:
- Communicating with people.
- Understanding how organisations operate.
- Improving business processes.
- Solving operational challenges.
- Recommending practical solutions.
You'll spend more time understanding business needs than working directly with large datasets.
What If You Enjoy Both?
Many learners discover they enjoy both technical analysis and business problem-solving. If that sounds like you, don't worry, you don't have to choose immediately.
Many professionals eventually move into business intelligence, business analytics, data-driven operations, or digital transformation roles, where technical and business skills come together.
The most important step is to build a solid foundation first. As your confidence and experience grow, you'll naturally discover which direction suits you best.
Once you have a sense of which path appeals to you, the next step is figuring out where to start. The good news is that both roles share a common set of foundational skills, and that's exactly what beginners should focus on first.
What Skills Should Beginners Learn First?
Starting a career in analytics can feel intimidating, especially when job descriptions list a wide range of technical skills and software. The good news is that you don't need to learn everything at once.
Instead of worrying about advanced programming languages or complex analytics tools, focus on building a strong foundation. Once you've mastered the basics, you'll find it much easier to learn more specialised skills as your career develops.
Start with the Essentials
Whether you eventually become a data analyst or a business analyst, there are several core skills that every beginner should develop.
These foundational abilities are used across almost every analytics role and provide the confidence needed to tackle more advanced tools later.
- Microsoft Excel: Learn to organise data, use formulas, build PivotTables, and create charts. Excel remains one of the most widely used tools in business and is the perfect starting point for beginners.
- Data Cleaning: Understand how to prepare raw data by removing errors, handling missing values, and structuring information for analysis.
- Charts and Visualisations: Develop the ability to present data clearly through graphs, bar charts, and line charts that tell a story at a glance
- Dashboards: Learn how to create interactive reports that allow decision-makers to monitor performance and track key metrics in real time.
- Simple Formulas and Functions: Get comfortable with basic calculations, logical functions, and lookups that form the backbone of data analysis.
- Basic Statistics: Understand averages, percentages, trends, and distributions so you can interpret what the data is actually saying.
- Reporting: Practice structuring clear, concise reports that translate numbers into actionable insights for non-technical audiences.
Understand the Business Problem First
While technical skills are important, they mean very little without context. That's why beginners should also learn how to frame business problems before diving into the data.
Before analysing any dataset, ask: What business challenge are we trying to solve?
Understanding the "why" behind the analysis helps you choose the right data, ask better questions, and deliver insights that actually drive decisions.
This business-first mindset is what separates a good analyst from a great one, and it's a skill that applies equally to data analysts and business analysts.
Advanced Tools Can Come Later
Once you've built confidence with the fundamentals, you can gradually expand your toolkit based on your chosen career direction.
- SQL: Useful for retrieving and managing data stored in databases. Essential if you plan to work with large datasets.
- Power BI: A powerful tool for creating interactive dashboards and visualising business data. Highly valued across industries.
- Python: A programming language used for more advanced data analysis, automation, and machine learning. Ideal if you're leaning toward a technical data analyst path
- Process Mapping: Relevant for business analysts who need to document workflows, identify inefficiencies, and recommend improvements.
The key is to learn these tools progressively rather than trying to master everything at once. Building a solid foundation first makes it much easier to understand how each tool supports real-world business decision-making.
For beginners looking for structured guidance, beginner-friendly courses in Excel, Power BI, and analytics provide a clear pathway to develop these skills step by step.
Once you've built that foundation, you might be wondering what comes next. A beginner course isn't just about learning tools; it opens the door to real career opportunities and more advanced learning pathways.
What Can You Do After a Beginner Analytics Course?
Completing your first analytics course isn't the end of your learning journey; it's the beginning of it.
A strong foundation in analytics opens the door to a wide range of career opportunities and more specialised learning pathways.
Explore Different Career Paths
After completing a beginner Analytics course, you may choose to pursue roles such as:
- Junior Data Analyst
- Reporting Executive
- Business Analyst
- Business Intelligence Analyst
- Operations Analyst
- Data Reporting Executive
These roles value the foundational skills you've developed: data handling, reporting, visualisation, and business problem-solving.
As you gain practical experience, you can continue developing your expertise in areas that align with your interests and career goals.
Continue Building Your Skills
While your beginner course has given you a strong start, analytics is a constantly evolving field. Professionals typically expand their skills over time rather than learning everything at once.
As you progress, you may explore more advanced areas such as:
- AI-driven analytics: Understanding how machine learning and artificial intelligence are transforming data analysis.
- Advanced dashboard reporting: Moving beyond basic visualisations to create dynamic, real-time business intelligence tools.
- Data-driven operations: Applying analytics to optimise supply chains, customer experiences, and operational efficiency.
- Digital transformation: Supporting organisations as they adopt data-driven approaches to business strategy.
The key is to build your skills progressively, focusing on one area at a time. A solid foundation will make it easier to understand more advanced concepts and adapt as technology continues to evolve.
Build a Portfolio That Showcases Your Skills
Employers are often interested in how you have applied the knowledge you have gained. As you complete projects during your training, start building a portfolio that demonstrates your analytical thinking and problem-solving abilities.
Your portfolio could include:
- Interactive dashboards
- Sales or operational reports
- Data visualisations
- Business case studies
- Process improvement recommendations
- Classroom or workplace projects
Here's a practical example of what a strong analytics portfolio can look like:
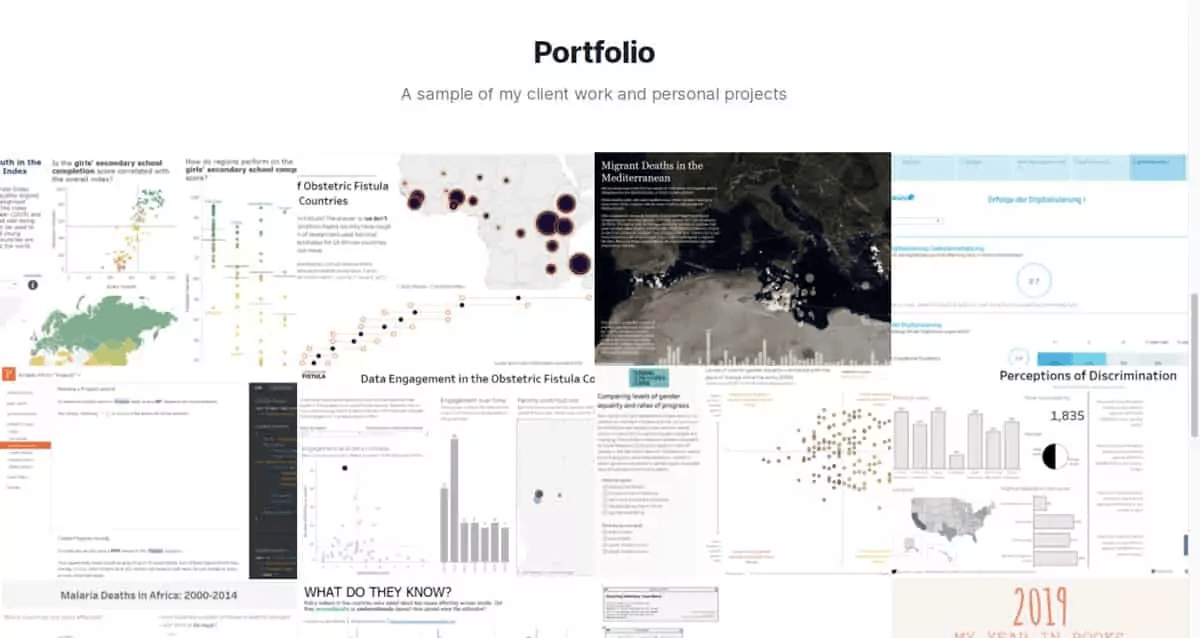
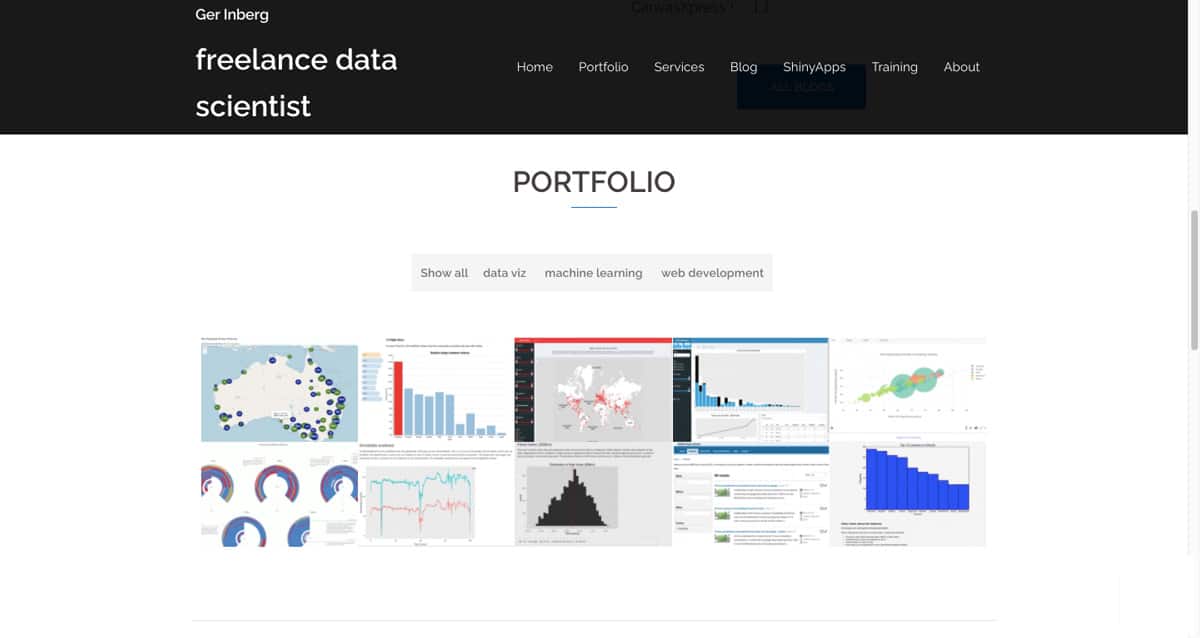
Data Analyst Portfolio Examples (Source: CareerFoundry)
Even simple projects can demonstrate your ability to organise information, analyse data, and communicate meaningful insights.
A strong portfolio not only showcases your technical skills but also proves that you can apply them to solve real business problems.
Continue Your Analytics Journey with @ASK Training
If you're still deciding between becoming a data analyst or a business analyst, that's perfectly normal. Many learners begin by building a broad understanding of analytics before choosing a more specialised direction.
@ASK Training offers beginner-friendly, structured courses that help learners develop practical analytics skills step by step.
Here are some of the key pathways to consider:
1. Start with a Solid Foundation in Excel
Microsoft Excel is the starting point for almost every analytics career. @ASK Training offers a range of Microsoft Excel courses designed to build your confidence from the ground up.
These courses provide the essential data handling, formula, and reporting skills that both data analysts and business analysts rely on every day.
For those looking to specialise further, @ASK Training also offers:
- Bridging Big Data Analytics using Excel & Power BI: Combine Excel and Power BI to create interactive insights and impactful dashboards.
- Data Visualisation and Storytelling with Power BI: Transform raw data into clear, interactive dashboards using Power BI's powerful visualisation tools.
- Data Visualisation and Storytelling with Tableau: Master Tableau to design compelling dashboards and deliver data-driven insights.
2. Earn a Professional Certificate in Business Analytics & Statistics with Excel
For learners who want a comprehensive, structured programme, the Professional Certificate in Business Analytics & Statistics with Excel is an ideal choice.
This WSQ-aligned programme takes you from Excel essentials to advanced statistical methods, predictive modelling, and data visualisation, earning you an industry-recognised certification along the way.
3. Explore the Future with AI-Driven Business Intelligence
For those ready to explore cutting-edge tools, the AI-Driven Business Intelligence: Smarter Reporting & Analytics course teaches you to automate reporting, build intelligent dashboards, and use generative AI tools like ChatGPT and Microsoft Copilot to make faster, smarter decisions.
4. Choose Your Path Forward
By starting with the fundamentals, you'll gain confidence in data analysis, reporting, and business problem-solving before progressing to more specialised areas.
Whether your goal is to become a data analyst, a business analyst, or simply develop stronger analytical skills for your current role, building a solid foundation will prepare you for future learning and career opportunities.
Explore our beginner-friendly courses and take the first step towards your analytics career with @ASK Training today!
As we wrap up, let's bring everything together. The choice between data analyst and business analyst doesn't have to be a final decision; it’s about understanding your strengths and taking that first confident step.
Conclusion
The simplest way to remember the difference is this: data analysts work directly with data, collecting, cleaning, analysing, and visualising it to uncover patterns and trends.
Business analysts work directly with people and processes, understanding business challenges, gathering requirements, and recommending solutions that drive organisational change.
Both roles help organisations make better decisions, but they approach the problem from different angles.
- Data analysts ask, "What does the data show?"
- Business analysts ask, "What should the business do about it?"
- Neither is better than the other; they're simply different ways of contributing to the same goal.
The right choice depends on your strengths, interests, and preferred way of working—not on which job title happens to be trending.
If you're still unsure which direction to take, that's perfectly normal. The most important step is to start building a solid foundation in analytics.
Developing core skills in data handling, reporting, visualisation, and business problem-solving will prepare you for a wide range of opportunities and help you choose your future specialisation with confidence.
Remember, your first course isn't about locking in a career for life; it's about opening doors, building confidence, and discovering where your strengths truly lie.
Ready to take that first step? Explore @ASK Training's beginner-friendly courses and start your analytics journey today!