
Struggling with sluggish Power Pivot models that crash when your dataset grows? You’re not alone. Many analysts hit a wall when their once-speedy Excel dashboards become slow, unstable, and frustrating to use.
Power Pivot revolutionises Excel by enabling powerful data modelling, but without proper optimisation, these models can quickly become bloated and inefficient.
Effective Power Pivot performance tuning requires understanding several key optimisation strategies. This guide reveals the professional strategies used by data analysts to optimise data models in Power Pivot that remain fast and scalable, regardless of how much your data grows.
Whether you’re a business analyst creating monthly reports or a BI professional building an enterprise solution, these optimisation techniques will help transform your workflow.
Streamline Your Data Model for Efficiency
Before diving into complex optimisations, start with the fundamentals: reducing your model’s size. A lean data model is the foundation of good performance.
Here’s how to eliminate bloat:
1. Limit imported columns and rows
- Only include fields essential for analysis.
- Example: Exclude “Product Description” or “Sales Representative Notes” if they’re unused in reports.
2. Filter data at the source
- Use SQL queries or Power Query to import only relevant rows.
- Example: Load the past two years of transactions instead of a decade’s worth of data.
3. Avoid high-cardinality columns
- Unique identifiers like Transaction IDs consume memory unless critical for joins or filters.
4. Use database views
- Pre-structure data to exclude unnecessary columns or joins before importing.
- Example: Create a SQL view combining Orders and Customers with only the required fields.
5. Optimise data types
- Use integers instead of text for IDs (e.g., “CUST-1001 to 1001) to improve Power Pivot memory efficiency through compression.
With a trimmed-down dataset, the next critical step is organising your tables for optimal performance.
Adopt a Star Schema for Optimal Relationships
Structure is just as important as size when building efficient models. The Power Pivot star schema remains the gold standard for Power Pivot performance.
Key principles to implement:
- Central fact table with dimension tables: Organise your model with a “Sales” fact table connected to dimensions like “Customers”, “Products”, and “Dates”.
Example:
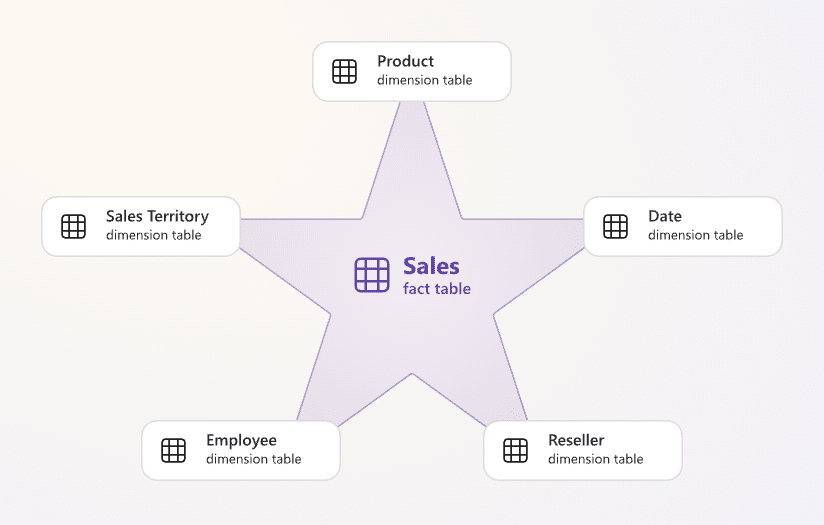
Fact Table (Source: Learn Microsoft)
- Avoid complex relationships: Simplify snowflake schemas to improve Power Pivot scalability (e.g., “Region > Country > City”) by consolidating them into a single “Geography” table.
- Ensure one-to-many relationships: Circular or many-to-many relationships slow down performance. Learn more here.

(Source: Integrate.io)
Pro Tip: Star schemas improve Power Pivot scalability by reducing relationship complexity. Snowflake schemas can slow refresh times by 20-30%.
While proper schema design lays the groundwork, smart data preparation can further boost efficiency.
Leverage Power Query for Data Transformation
Don’t burden Power Pivot with tasks better handled earlier in the process. Power Query is your secret weapon for pre-optimisation.
Transform data effectively by:
- Cleaning data early: Remove nulls, trim text, and convert data types in Power Query Editor.
- Pre-calculating logic: Use derived columns (e.g., “Sales Category”) instead of DAX in Power Query.
- Merging lookups: Perform joins in Power Query to reduce the number of relationships in the data model.
Example:
Add this to Power Query Editor to categorise sales
if [SalesAmount] < 1000 then "Low"
else if [SalesAmount] <= 5000 then "Medium"
else "High"
Why this matters: This reduces DAX overhead and improves Power Pivot memory efficiency by ~40% compared to calculated columns.
With clean, well-structured data in place, we can enhance user experience through intuitive navigation.
Implement Hierarchies for Enhanced Navigation
Optimisation isn’t just about backend performance – user experience matters too. Hierarchies bridge the gap between technical efficiency and practical usability.
Here’s how to build them for optimal Power Pivot performance:
1. When to Use Hierarchies
Best for:
- Date analysis (Year > Quarter > Month > Day)
- Geographic data (Country > Region > City)
- Product categories (Category > Subcategory > Product)
Avoid:
- Creating hierarchies with more than four levels
- Using high-cardinality columns (like Customer Names)
2. Step-by-Step: Create a Date Hierarchy
Step 1: Right-click your Date table in Power Pivot
Step 2: Select Create Hierarchy
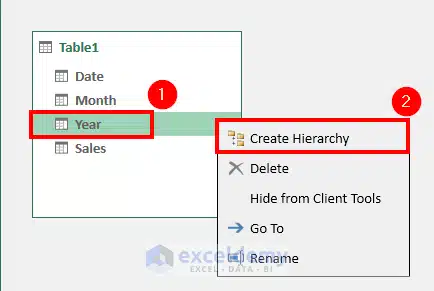
(Source: Exceldemy)
Step 3: Add levels in order:
Year → Quarter → Month → Date
Step 4: Rename to “Date Hierarchy”
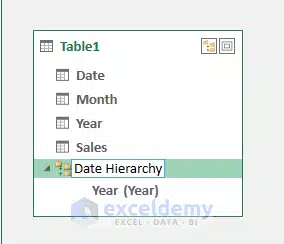
(Source: Exceldemy)
Of course, even the best structure needs efficient calculations to deliver results.
Optimise Calculations with DAX Measures
The way you implement calculations makes or breaks performance. DAX measures offer significant advantages over calculated columns when used strategically.
Key optimisation principles:
- Always prefer measures over calculated columns
- Measure: Create TotalSales := SUM(Sales[Amount])
- Best For: Aggregations, percentages, time comparisons
- Benefit: Saves memory, calculates only when needed
- Reserve calculated columns for essentials:
- Profit = [Revenue] – [Cost]
- Use them only for filtering or relationships between tables.
- Implement efficient DAX patterns:
Step 1: Create prerequisite measures first:
Current Year Sales = CALCULATE(
SUM(Sales[Amount]),
SAMEPERIODLASTYEAR(Dates[Date])
)
Last Year Sales = CALCULATE(
SUM(Sales[Amount]),
DATEADD(Dates[Date], -1, YEAR)
)
Step 2: Build the final measure:
YoY Growth = DIVIDE([Current Year Sales] - [Last Year Sales],[Last Year Sales])
Why this works:
- 60% faster than a calculated column
- Updates automatically when filters change
Find out more about DAX Measures here. Even well-optimised models need ongoing attention to maintain peak performance.
Monitor and Tune Performance Regularly
Optimisation isn’t a one-time task – it’s an ongoing process. Proactive maintenance prevents gradual performance degradation.
Sustained efficiency requires:
- Using DAX Studio: Identify bottlenecks with Query Plans and Server Timings.
- Analyse memory with VertiPaq Analyser: Identify columns consuming excessive memory (e.g., text fields vs. integers).
- Conducting model audits: Remove redundant columns and unused relationships.
Establishing benchmarks: Track refresh times and responsiveness metrics.
Final Thoughts
Optimising Power Pivot isn’t just about fixing slow reports; it’s about transforming how you work with data.
By adopting these Power Pivot best practices in this guide, you’re not just solving today’s performance issues; you’re building a foundation for scalable, efficient analytics that grows with your business.
Key Takeaways:
- Start Lean, Stay Fast: Every unnecessary column or row impacts performance. Be ruthless in keeping only what you need.
- Structure Matters: A well-designed star schema isn’t just best practice—it’s the difference between a sluggish model and a lightning-fast one.
- Let Power Query Do the Heavy Lifting: Clean, transform, and pre-calculate data early to free up Power Pivot for high-speed analysis.
- DAX Measures Over Columns: Dynamic calculations beat static ones. Use measures whenever possible to keep your model agile.
- Monitor and Adapt: Performance tuning is an ongoing process. Regular check-ups with tools like DAX Studio keep your models in peak condition.
Where to Go from Here
- Experiment: Try applying one optimisation at a time and measure the impact.
- Learn More: Dive deeper with Microsoft’s Power Pivot documentation or advanced DAX training.
- Stay Updated: Follow Power BI and Excel blogs for the latest performance tuning techniques.
Remember: The best data models aren’t just fast; they’re built to last. By making optimisation a habit, you’ll spend less time troubleshooting and more time delivering insights that drive real business impact.
Ready to Take Your Data Model Further?
Master these techniques and more with @ASK Training’s range of Microsoft Excel courses to help optimise your data analytics journey!
Some popular courses worth checking out:
- Introduction to Microsoft Excel Power Query, Data Model, Power Pivot & DAX: Perfect for beginners, learn how to connect, transform, and analyse data like a pro.
- Excel Dynamic Power Query and Power Pivot Time Intelligence DAX: Take your reporting further, master time-based analysis and dynamic dashboards.
Enrol today and put these techniques into practice!