Despite the surge of AI, automation, and analytics platforms, one tool remains a constant in job descriptions across industries: Microsoft Excel.
Far from being replaced, Excel’s presence in job postings has surged, proving that even in an AI-driven era, human-led analysis and data agility are irreplaceable.
This article will clarify exactly what Excel skills employers want in 2025 and beyond, breaking them into clear tiers, from the assumed basics to advanced analytical functions.
You’ll learn not only what’s required, but how to strategically build and showcase these competencies to accelerate your career.
But first, let’s examine why Excel remains indispensable, even when newer tools abound.
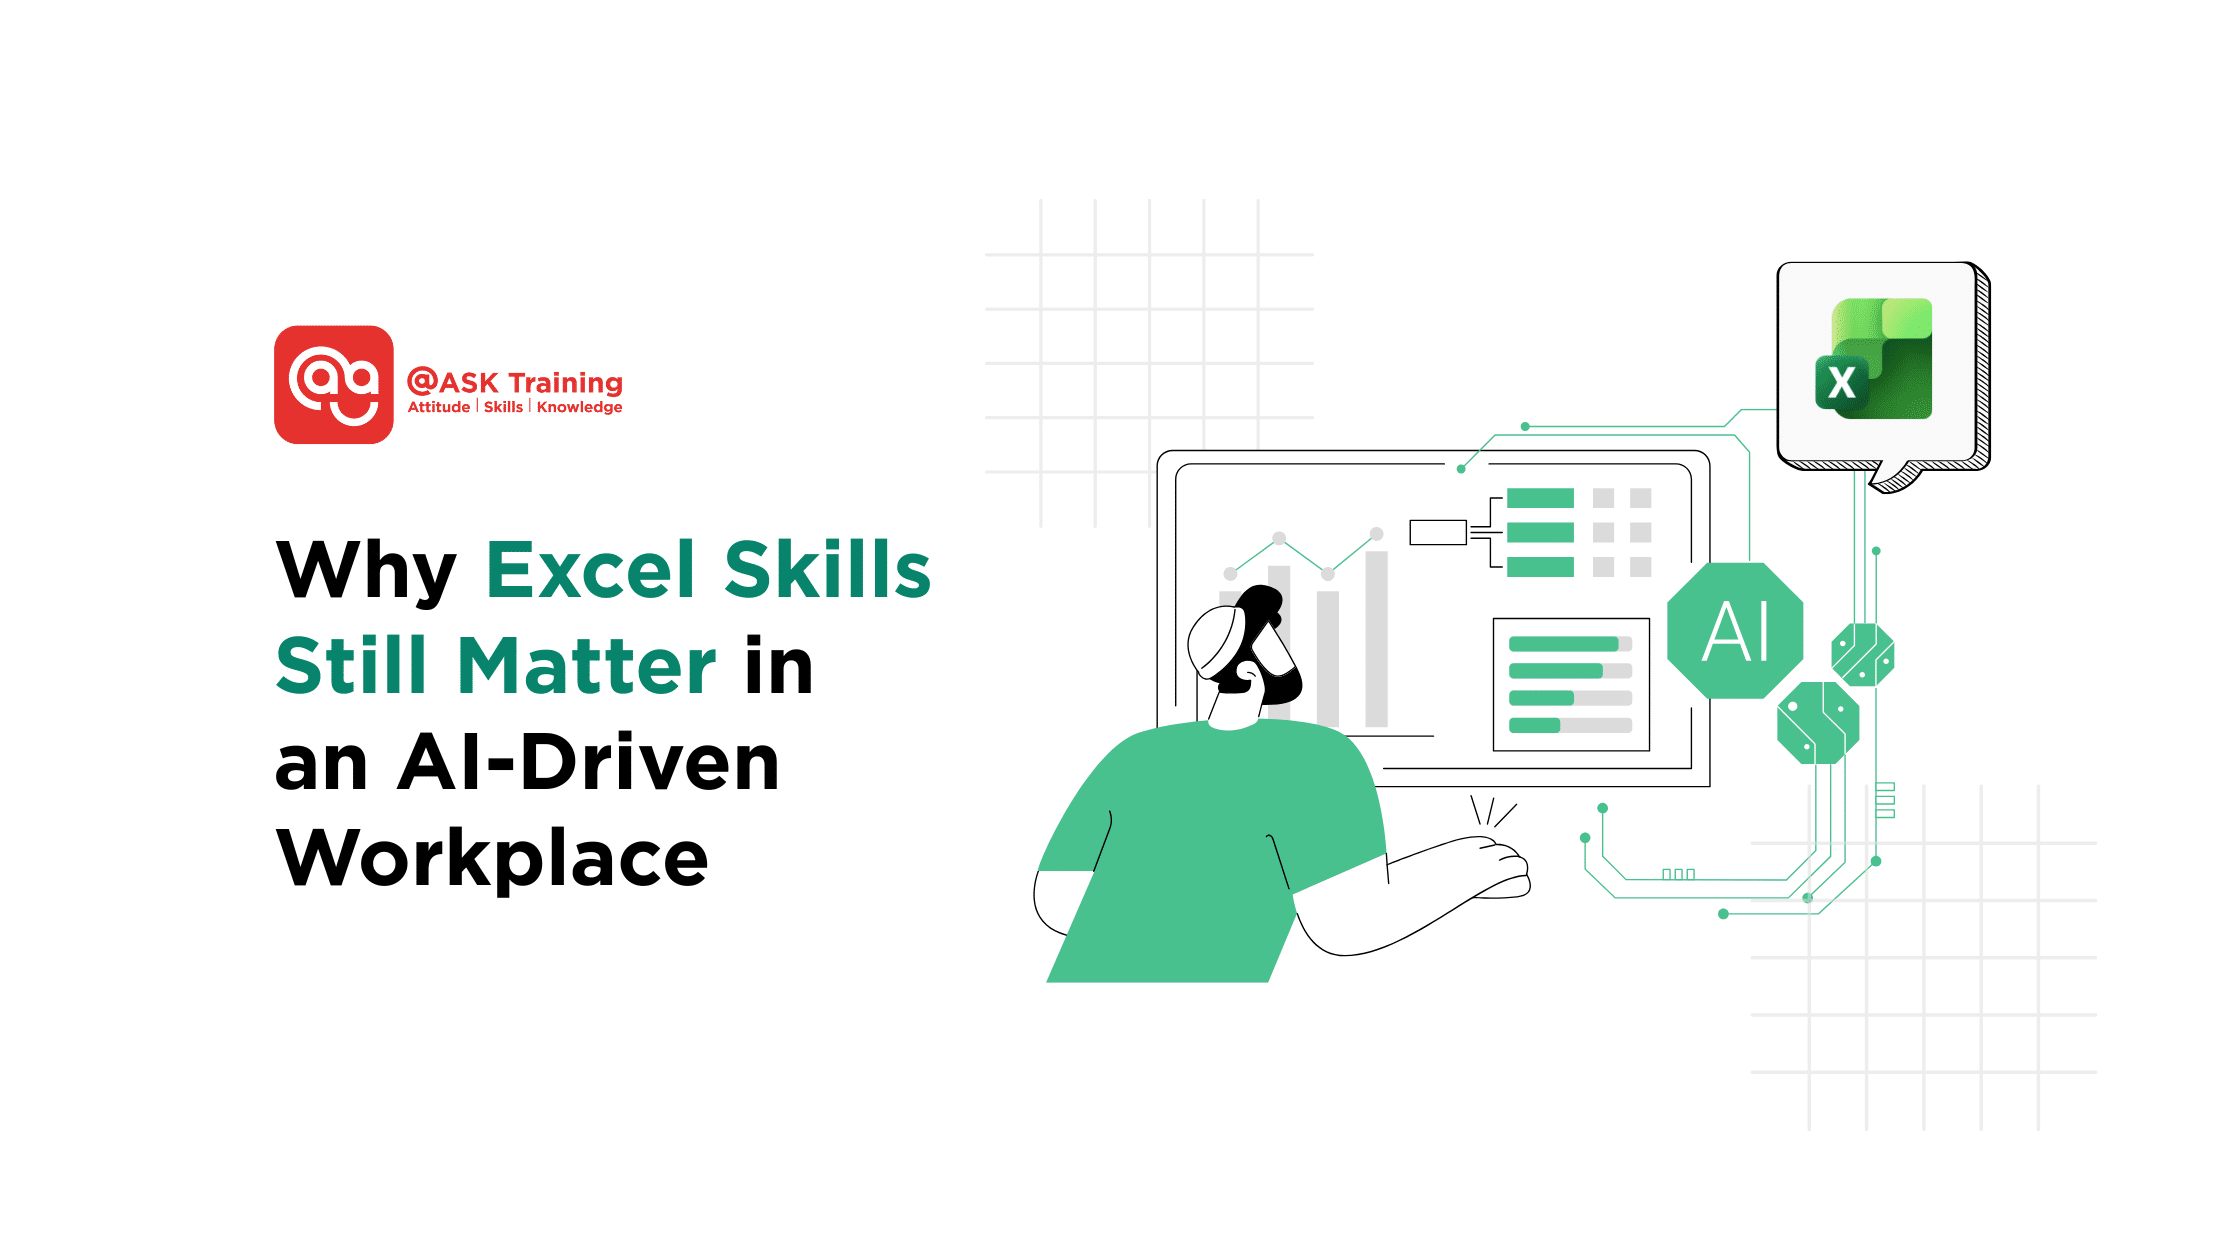
Why Excel Skills Still Matter in 2026
A 2025 Business Insider analysis revealed a striking fact: Excel appeared in more technology-related job postings (531,000 job postings) than many in-demand programming languages, proving its irreplaceable role in the modern professional toolkit.
Why does this decades-old software persist in an AI-driven world? Because Excel fulfils a unique and critical function: it operates at the human intersection of data and decision-making.
While enterprise systems store data and BI dashboards visualise it, Excel is where the analytical work actually happens.
It serves as the universal workspace where:
- Data is exported for final validation, sense-checking, and ad-hoc investigation
- New, unscripted questions are explored after the standard dashboard has been consulted
- Teams from HR, Finance, Marketing, and Operations find a common language to collaborate
- Management can then significantly make faster, clearer, and more informed decisions
In essence, Excel empowers non-technical professionals to engage directly with data, fostering autonomy and speeding up insight.
The professional divide is clear: those with weak Excel skills create bottlenecks and dependencies, while those with strong Excel skills build credibility, accelerate workflows, and position themselves for analytical and leadership roles.
Now that we’ve established why Excel remains non-negotiable, let’s define what proficiency actually means.
We’ll break down the essential Excel skills, tier by tier, starting with the foundational abilities every employer assumes you have.
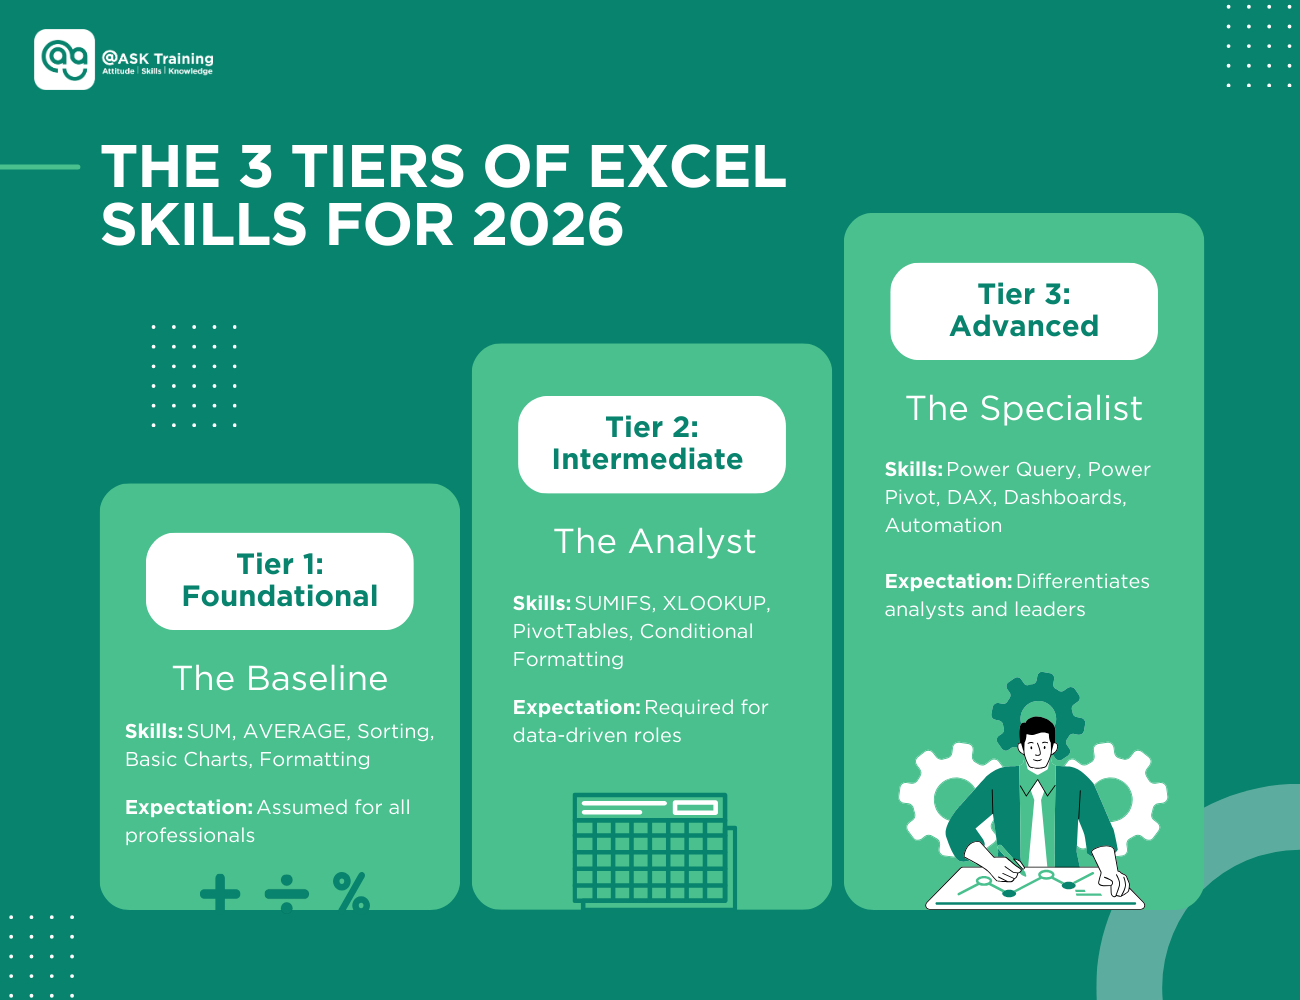
The Foundation: Core Excel Skills Every Employer Expects
Mastering advanced analytics is impressive, but you’ll never get the chance to prove it if you stumble on the fundamentals.
This brings us to the core Excel skills that employers don’t bother listing as “preferred”—they simply assume every professional has them.
These competencies are your baseline ticket to credibility; they won’t make you stand out, but their absence will immediately hold you back.
Think of these as the professional hygiene of data work. At a minimum, you are expected to be fully comfortable with:
- Essential Formulas: Confidently using SUM, AVERAGE, COUNT, and simple IF statements for everyday calculations.
- Data Organisation: Efficiently sorting and filtering datasets and converting raw ranges into structured Excel tables for better management.
- Basic Visualisation: Creating straightforward charts, columns, lines, or pies, to turn numbers into visual information.
- Data Insights: Utilising conditional formatting and trendlines to highlight critical data and reveal performance direction.
- Professional Presentation: Formatting worksheets for clarity with proper number formats, alignment, and headers to ensure your work is instantly readable.
Why Do These Basic Excel Skills Matter So Much?
In practice, they are less about technical prowess and more about professional trust. They signal reliability, attention to detail, and the ability to deliver clean, usable work.
Demonstrating these skills shows you won’t create messy, error-prone outputs that colleagues or managers must waste time correcting.
As noted by resources like the Corporate Finance Institute, these are consistently listed as assumed workplace competencies.
A Real-World Example:
Consider an HR coordinator tasked with a monthly headcount report. Using SUMIFS, they quickly total employees by department. They then apply filters to review attrition patterns month-over-month.
Finally, they format the worksheet clearly, freezing headers, applying cell styles, and ensuring number consistency, so the report is immediately presentable to management. This entire process relies not on advanced Excel for data analysis, but on flawless execution of foundational Excel skills for jobs.
Possessing these skills means Excel is a tool, not a bottleneck. But to truly unlock its potential and move from processing data to informing decisions, you need to master the next tier: intermediate Excel skills that transform you from a user into an asset.
Step-Up Skills: Intermediate Functions & Data Handling
Mastering the fundamentals means you won’t make mistakes. Mastering intermediate Excel skills means you start answering the questions that move the business forward.
This tier represents the critical shift from being a passive spreadsheet user to an active insight generator.
For roles in operations, sales, marketing, finance, and reporting, this isn’t just an advantage—it’s increasingly the true minimum expectation for job readiness.
These intermediate Excel skills empower you to manipulate data dynamically and answer follow-up questions on the fly, without rebuilding reports from scratch.
The key competencies include:
- Advanced Logic & Aggregation: Moving beyond basic IF to master IFS, AND/OR combinations, and powerful aggregation with SUMIFS and COUNTIFS.
- Efficient Data Retrieval: Using modern lookup functions, with a strong emphasis on XLOOKUP to find and pull data accurately.
- Dynamic Summarisation: Creating PivotTables and PivotCharts to quickly slice, dice, and visualise large datasets.
- Visual Data Storytelling: Applying dynamic and formula-based conditional formatting to automatically highlight trends, variances, or outliers.
- Data Integration: Confidently combining data from multiple sheets to create unified views and reconcile information.
How do these skills translate to real impact? They transform Excel from a presentation tool into an engine for efficient insight delivery.
Example:
A sales executive needs to analyse performance. Instead of a static table, they create a PivotTable to break down monthly revenue by product. They then add slicers to instantly filter the view by region.
Finally, they apply conditional formatting to automatically highlight any underperforming segments in red. In minutes, they’ve generated a clear, interactive analysis that answers not only the initial question but also inevitable follow-ups about regional performance—all without editing a single formula in the source data.
This level of proficiency turns data into a decision-support system. But when you’re faced with massive, messy datasets or the need to automate and model complex scenarios, you need to leverage the advanced toolkit that separates proficient users from true experts.
Advanced Excel Skills: Analytics, Automation & Big Data Tools
While not every role demands this level of mastery, advanced Excel skills are what truly differentiate analysts, senior professionals, and specialists who turn chaos into clarity.
This tier is essential for those working with large, complex, or unstructured datasets, transforming Excel from a calculation tool into a lightweight analytics and automation platform.
These capabilities move far beyond formulas and pivot tables, focusing on scalable data management and sophisticated modelling:
- Power Query: For automating the import, cleaning, and transformation of raw data from multiple sources, the essential first step in Excel for data analysis with messy inputs.
- Power Pivot & DAX: For building robust data models with relationships across large tables and writing DAX formulas for advanced, business-logic calculations.
- Dynamic Arrays: Using modern functions like FILTER, SORT, and UNIQUE to create powerful, spillable formulas that automatically adjust.
- Automation & Dashboards: Leveraging VBA or macros to automate repetitive workflows and building interactive, dashboard-style reports for management consumption.
Mastering these advanced Excel skills shifts your value proposition: you’re no longer just working in Excel; you are engineering solutions with it.
Example:
An operations analyst receives fragmented logistics data weekly from several regional systems. They use Power Query to build a single, automated workflow that cleans and merges this data.
They then load it into Power Pivot to create a unified data model. Using DAX formulas, they build calculated measures for trend analysis and generate a forecast for next quarter’s capacity needs.
The final output is an interactive dashboard that allows management to explore volume fluctuations by lane and week, turning a weekly manual headache into a strategic planning asset.
As highlighted by industry resources like FDM Group, these advanced Excel skills are highly valued in organisations reliant on Excel-based reporting because they dramatically reduce manual work, minimise errors, and ensure consistency, directly impacting operational efficiency and reliability.
Understanding these skill tiers is one thing; recognising how employers ask for them is another.
Next, we’ll decode the language of job descriptions so you can match your skills to their hidden expectations.
How Employers Signal Excel Skills in Job Listings & Resumes
Job descriptions rarely state “requires intermediate Excel” outright. Instead, savvy hiring managers embed expectations within the language of the role itself. Decoding these cues is essential to targeting your applications effectively.
Here’s how to interpret common phrases, moving from foundational to advanced Excel skills:
- “Proficient in Excel” or “Strong Microsoft Office skills”
This is the baseline signal. It implies foundation-level Excel skills: reliability with core formulas, sorting, filtering, and producing clean, formatted work.
- “Experience with PivotTables, dashboards, and reporting”
This clearly points to intermediate Excel skills. It calls for independent analysis, data summarisation, and the ability to generate insights, not just lists.
- “Advanced Excel required (Power Query, Power Pivot, VBA, modelling)”
This explicitly demands advanced Excel skills. It signals analyst-level, data-heavy responsibilities involving automation, data modelling, and transforming raw data into business intelligence.
Hiring managers often assess Excel skills indirectly by looking at:
- Ownership of reports and metrics
- Ability to respond to ad-hoc questions
- Speed and independence in handling data tasks
Therefore, your resume must move beyond generic claims. Mirror their language with precise, outcome-oriented examples.
Weak vs Strong Resume Language:
- Generic (Low Impact): “Advanced Excel user.”
- Specific (High Credibility): “Developed a Power Pivot model integrating HR and payroll data to analyse labour cost trends, reducing monthly reporting time by 40%.”
Specificity—naming the tool (Power Pivot), the action (integrating, analysing), and the quantifiable outcome (40% time savings)—eliminates ambiguity and proves your proficiency.
Closing the Gap: How You Can Build & Demonstrate Excel Skills
The most common mistake professionals make is learning Excel randomly. Effective skill-building is sequential.
A practical progression looks like this:
- Master clean data structure and PivotTables: Ensure you can organise and summarise any dataset.
- Learn modern lookup functions (XLOOKUP) and conditional logic (IFS, SUMIFS), the core of dynamic analysis.
- Advance into Power Query: Automate the cleaning and preparation of raw data.
- Build dashboards—but only after your underlying data model is robust and reliable.
Jumping straight to dashboards without understanding data structure leads to fragile, hard-to-maintain files.
Practical ways to build skills include:
- Practice on Real Data: Use public datasets (e.g., from Kaggle) or anonymised workplace data to simulate real challenges.
- Rebuild and Improve: Take an existing report at work and rebuild it with cleaner formulas, a PivotTable, or a Power Query workflow.
- Automate One Task: Identify a single repetitive weekly task and automate it using either Power Query or a simple macro.
- Create a Mini-Portfolio: Develop 2–3 sample dashboards or analysis reports that solve a clear business problem.
How to Showcase Skills to Employers
When discussing your Excel skills, always frame them in terms of impact:
- Describe what you built (e.g., “a forecasting model,” “an automated reconciliation report”).
- Explain the business problem it solved (e.g., “to track inventory turnover,” “to reduce manual data entry errors”).
- Quantify the outcome wherever possible (e.g., “saved 5 hours per week,” “reduced reporting errors by 15%”).
Remember, Excel skills are a long-term career investment. They compound over time and serve as a direct gateway into more advanced roles in business intelligence (BI), data analysis, and process automation.
Conclusion: Excel as a Long-Term Career Skill
Excel skills in 2026 fall into three clear tiers:
- Foundation skills that employers assume
- Intermediate skills that signal job readiness
- Advanced skills that differentiate analysts and senior professionals
Despite the rise of AI and BI tools, Excel remains critical because it bridges systems, teams, and decisions. It adapts alongside new technology rather than being replaced by it.
For working professionals, Excel is not a one-time skill to check off a list. It is a long-term capability that increases autonomy, credibility, and career mobility across roles and industries.
By investing in a structured journey from foundation to advanced proficiency, you unlock higher productivity, better roles, and cross-functional opportunities.
Used well, Excel remains one of the most practical and valuable professional skills available today.
Ready To Strategically Build And Showcase Your Excel Expertise?
Whether you’re an individual looking to accelerate your career or an organisation aiming to elevate your team’s analytical capabilities, Microsoft Excel courses at ASK Training are designed for real-world impact.
Here are some of our popular Excel courses worth exploring:
- WSQ Microsoft Excel Essentials: Build essential working skills for effective data management and analysis.
- WSQ Microsoft Excel Intermediate: Learn Excel features to enhance productivity with data management and reporting.
- WSQ Microsoft Excel Advanced: Take your expertise to the next level with advanced functions, macros, and automation techniques.
- WSQ Microsoft Excel Mastery: Gain mastery-level Excel skills to analyse large datasets, identify trends, and deliver insights.
Professionals who complete all four WSQ Microsoft Excel modules are eligible to earn the Professional Certificate in Business Analytics & Statistics with Excel, formally recognising comprehensive expertise and strategic analytical capabilities.
Explore our tailored learning paths to assess skill levels, close competency gaps, and drive measurable productivity gains.