
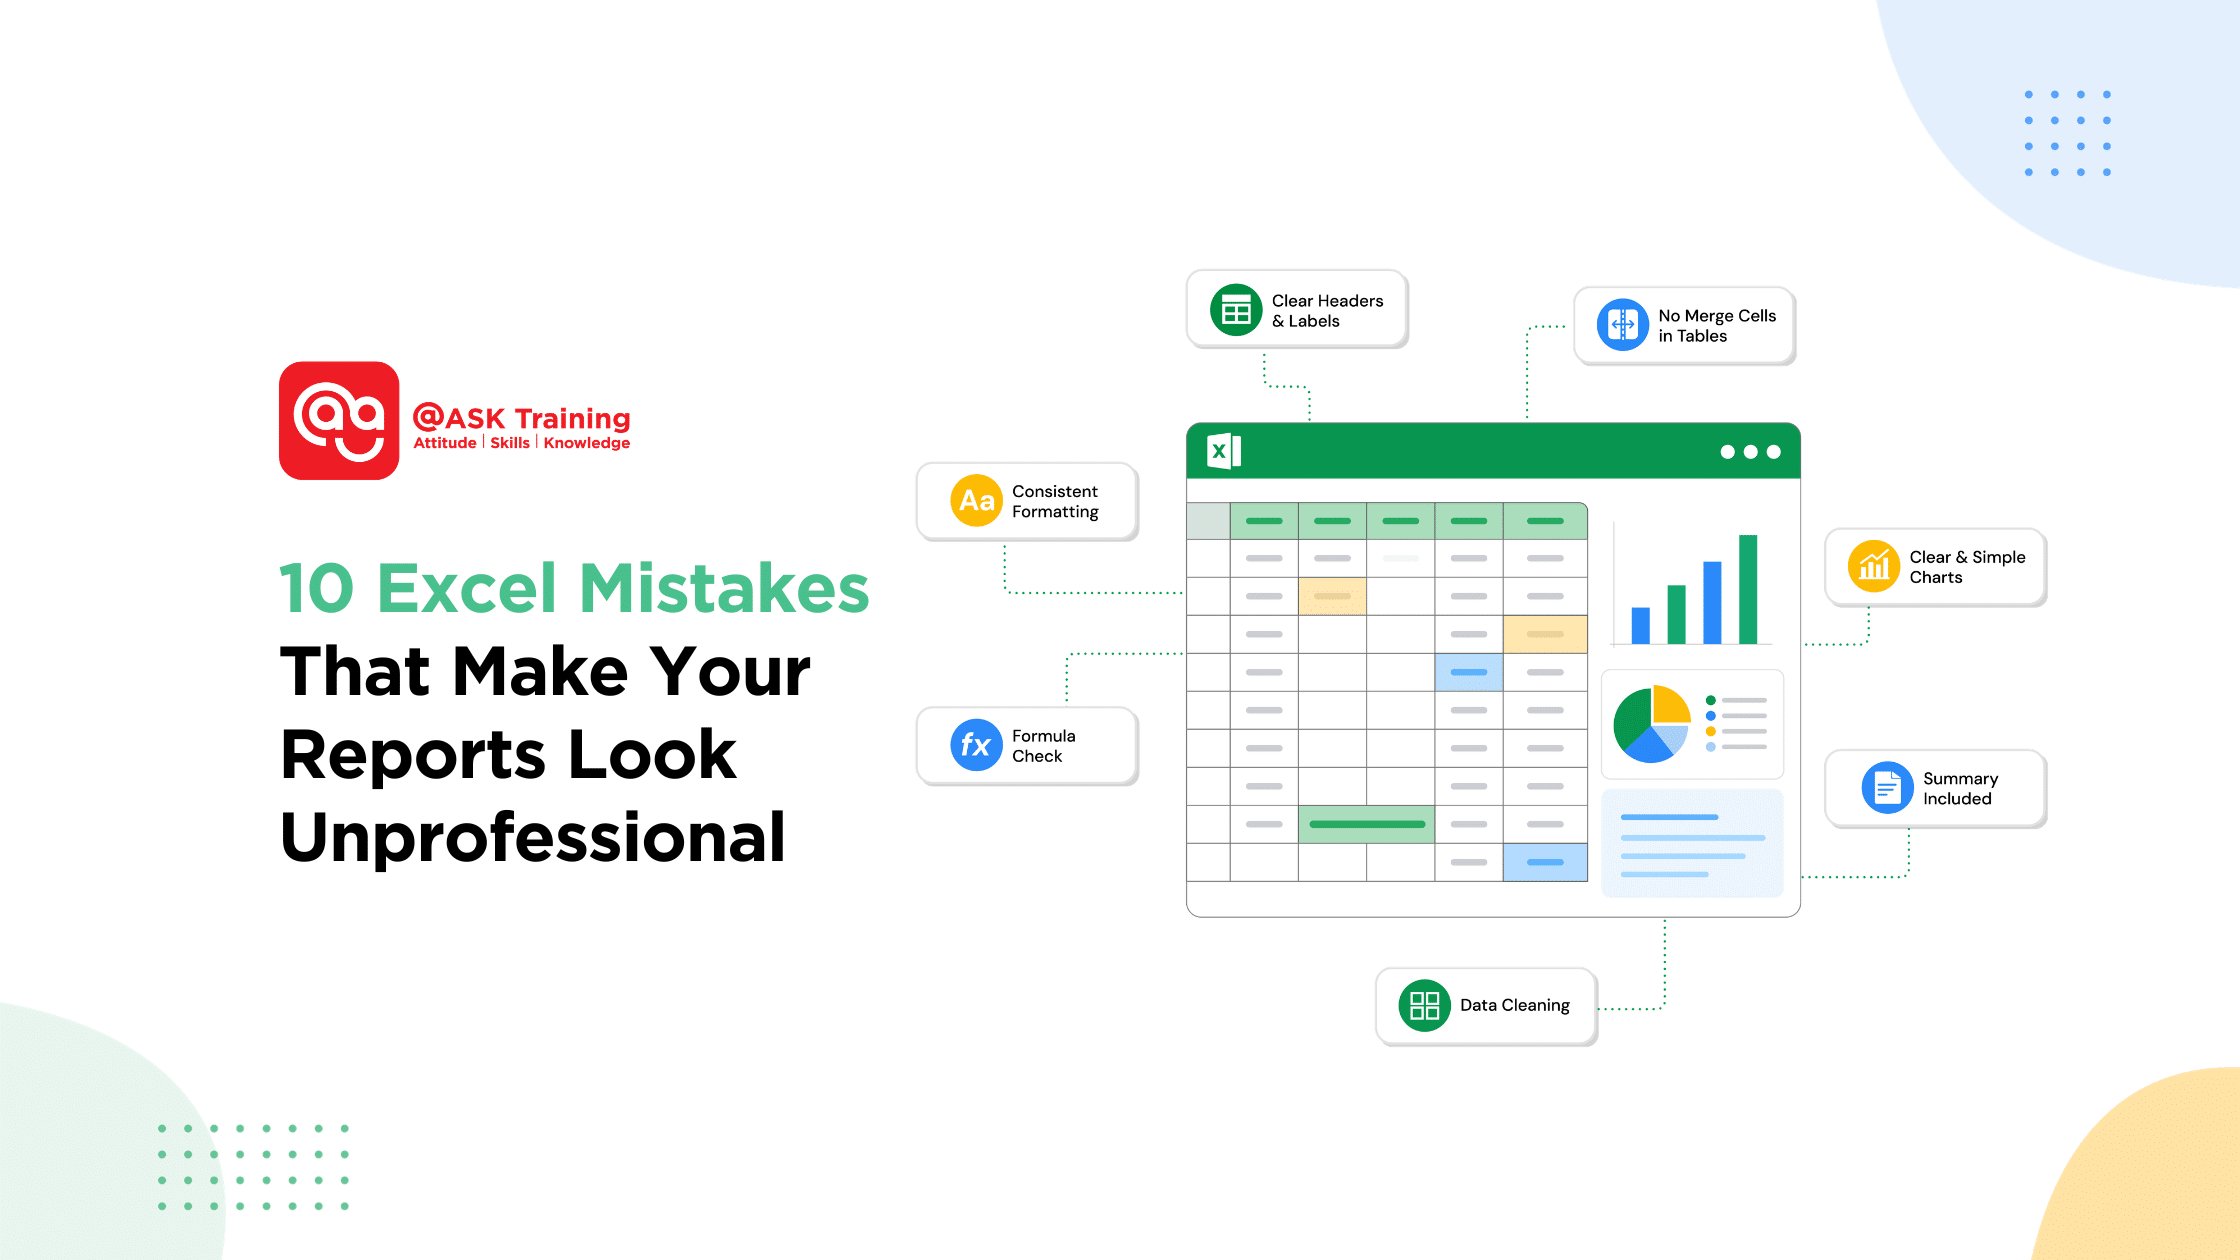
You’ve spent hours pulling the data, checking the logic, and making sure every number adds up. But when you step back and look at your spreadsheet, something feels off.
It is busy. It is confusing. And frankly, it does not look like something you want to send to your manager or a client.
Here is the frustrating truth: even the most accurate Excel report can lose all credibility if it looks messy or feels hard to read. Small issues, like inconsistent formatting, broken formulas, or unclear labels, can make people question whether they can trust the data at all.
The good news is that most of these issues are easy to fix. Think of this article as your practical checklist. Below, we walk through the most common Excel mistakes that turn professional reports into confusing puzzles.
For each mistake, we explain what it looks like and, more importantly, exactly how to fix it.
Before we dive into the fixes, let’s first understand why the way you present your data matters just as much as the data itself.
Why Professional Excel Report Matters
Excel reports are rarely just for you. They get sent to decision-makers, leadership teams, clients, and internal stakeholders who need to quickly understand what is happening.
When a report looks sloppy, those readers start to hesitate. They wonder: If the formatting is this inconsistent, can I trust the totals?
That is the real cost of Excel mistakes. You lose trust before anyone even reads a single number. Professional reports do not just look nice; they make information easier to understand, faster to act on, and harder to misinterpret.
Now, let’s get into the ten specific mistakes that could be undermining your hard work.
Mistake 1: Inconsistent Formatting
You have probably seen this before. One column shows dates as “Jan 10, 2026.” Another column uses “01/10/26.”
Currency jumps from “$12,500” to “12500” to “12.5k.” Decimal places appear and disappear without explanation.
Why it hurts:
Inconsistent formatting makes your report look thrown together. It also confuses readers who are trying to compare numbers or spot trends.
The fix:
Choose one style for each data type and stick to it throughout the entire report. Use the same date format, the same currency symbol placement, and the same number of decimal places for similar figures.
Use Excel’s Format Painter tool to apply consistent styles across multiple sections quickly.
Mistake 2: Using Too Many Colours and Borders
Yes, colour can help highlight key information. But when every other cell has a different background shade, heavy borders, or neon fonts, your report starts to look like a rainbow explosion rather than a business document.
Why it hurts:
Too many colours and borders create visual clutter. Readers do not know where to look first, and the actual data gets lost in the noise.
The fix:
Use colour sparingly. Reserve it for truly important elements such as total rows, warning flags, or section headers.
Instead of heavy gridlines everywhere, rely on white space and subtle borders to separate data.
Clean, simple formatting almost always looks more professional than over-designed spreadsheets.
Mistake 3: Merging Cells in Tables
Merging cells might seem like an easy way to centre a heading across multiple columns. But inside a working data table, merged cells are a trap.
Why it hurts:
Merged cells break core Excel functions. You cannot sort properly. You cannot filter cleanly. Copying and pasting becomes unpredictable.
And anyone who tries to update your report later will spend frustrating hours untangling your structure.
The fix:
Avoid merging cells inside any table that needs to be sorted, filtered, or analysed.
Instead, use Centre Across Selection to visually centre without breaking functionality. A merged cell is sometimes acceptable for a report title far above your data, but never inside the actual data table itself.
Mistake 4: Hardcoding Numbers in Formulas
Take a look at this formula: =B2*0.08. Where did that 0.08 come from? Is it a tax rate? A discount? A commission percentage? In six months, will anyone remember?
Why it hurts:
Hardcoded values turn your formulas into mysteries. They are difficult to audit, nearly impossible to update globally, and dangerous if the same number appears in multiple places but needs to change.
The fix:
Put every assumption, rate, target, and input into its own clearly labelled cell. Then reference that cell in your formulas.
For example, put 0.08 in a cell named Tax_Rate and write =B2*Tax_Rate. Now, anyone can see what that number means and update it in one place when needed.
Mistake 5: Not Checking Formulas Before Sharing
You added a new column last week. Did you remember to extend the SUM formula? What about the percentage calculation that worked perfectly last month, is it still referencing the correct range?
Why it hurts:
One broken formula can silently undermine your entire report. A monthly total that stops at November instead of December, or a variance calculation that compares the wrong quarters, can lead to completely wrong conclusions.
The fix:
Before you share any report, audit your key calculations. Check totals, percentages, averages, and year-over-year changes.
Use Excel’s Trace Precedents and Trace Dependents tools to see exactly where your numbers are coming from. And always spot-check a few cells manually to catch errors Excel itself will not flag.
Mistake 6: Mixing Data Formats in the Same Column
Imagine a column labelled “Sales Quarter.” One row says “Q1.” Another says, “First Quarter.” A third says “1.” Now try to filter that column. Frustrating, right?
Why it hurts:
Mixed formats break sorting, filtering, and formulas. They also make your report look inconsistent and unpolished.
Excel spreadsheet mistakes like this are surprisingly common but completely avoidable.
The fix:
Pick one format per column and enforce it. Dates all follow the same pattern. Categories use identical spelling and capitalisation.
Percentages include the % symbol or do not, but never both. Use Data Validation to restrict what users can enter, which prevents format mixing before it starts.
Mistake 7: Leaving the Data Messy Before Building the Report
Blank rows scattered throughout. Duplicate entries are hiding in the middle of a list.
“Sales,” “sales,” and “Sales Team” all refer to the same thing but are spelt differently.
Why it hurts:
Messy source data leads to inaccurate summaries, broken charts, and dashboards that quietly exclude important information. You cannot build a clean report on top of dirty data.
The fix:
Clean your data before you create a single chart or summary. Remove blank rows. Deduplicate records.
Standardise category names using Find & Replace or a simple lookup table. This extra step upfront saves hours of confusion later and ensures your professional Excel reports actually reflect reality.
Mistake 8: Using Unclear Headers and Labels
“Revenue.” “Qty.” “Growth.” These labels might make sense to you, but do they make sense to your manager or client?
What does “Growth” mean? Revenue growth? User growth? Percentage or absolute number?
Why it hurts:
Vague labels force readers to guess or ask for clarification. Every moment they spend decoding your headers is a moment they are not engaging with your insights.
The fix:
Be specific. Instead of “Revenue,” write “Monthly Revenue ($SGD).” Instead of “Qty,” write “Units Sold.” Instead of “Growth,” write “YoY Revenue Growth (%)“.
Clear headers and chart titles with explicit units and time periods make your report instantly more understandable.
Mistake 9: Creating Confusing Charts
A 3D pie chart with twelve slices, each a different neon colour. A line chart with nine overlapping data series and a legend that requires a magnifying glass. A bar chart with no axis labels at all.
Why it hurts:
Confusing charts do not clarify your data; they obscure it. Readers walk away without understanding your main point, or worse, they misinterpret what the data actually shows.
The fix:
Choose the simplest chart that communicates your message. Use line charts for trends over time. Use bar charts for comparisons between categories. Remove 3D effects, reduce legend clutter, and label your axes clearly.
Most importantly, give your chart a title that explains the takeaway; not just “Revenue,” but “Revenue Increased 15% in Q3.”
Mistake 10: Not Including a Summary
You hand someone a detailed twelve-tab report. Their first question is almost always the same: “So… what am I looking at?”
Why it hurts:
Without a summary, you force your readers to do the work of finding the most important insights. Many will not bother.
They will skim, miss key points, and make decisions based on incomplete information.
The fix:
Add a short summary section at the top of your report. Include key KPIs, a few bullet points on what changed since the last period, and a clear statement of whether performance is above or below target. Think of it as the executive summary: if someone reads only this section, they should still walk away with the main story.
Quick Checklist Before Sharing Your Next Excel Report
Before you hit send or attach that file to an email, run through this final quality check. Think of it as your pre-flight checklist for professional Excel reports.
- Formulas: Did you check all totals, percentages, and key calculations?
- Hardcoded values: Are all assumptions in labelled cells instead of hidden inside formulas?
- Formatting: Are fonts, dates, currencies, and decimals consistent throughout?
- Labels: Do all headers and chart titles include clear units and time periods?
- Charts: Are they simple, labelled, and easy to read?
- Data cleanliness: Did you remove blank rows, duplicates, and inconsistent category names?
- Merged cells: Are there any merged cells inside your main data tables?
- Summary: Does your report start with a clear takeaway or KIP section?
Now that you have walked through the ten most common pitfalls and their practical fixes, let’s bring it all together.
Wrapping Up: Small Fixes, Big Impact
The difference between a messy spreadsheet and a polished, credible report often comes down to small habits.
Here’s a quick recap of the 10 Excel mistakes:
Avoiding these common Excel mistakes, from inconsistent formatting and hardcoded values to messy data and confusing charts, does not require advanced skills. It just requires attention to detail before you share your work.
Remember: people trust reports that look trustworthy. And a report that is clean, clear, and easy to read tells your readers that you respect their time and take your numbers seriously.
So next time you finish an Excel report, pause. Run the checklist. Make the small fixes. Then share your work with confidence, knowing that your spreadsheets look as professional as the insights they contain.
Transform Your Messy Spreadsheets into Professional Reports
At @ASK Training, we help professionals move beyond the basics and build reports that truly stand out.
Whether you want to master formulas, data visualisation, or dashboard design, our hands-on Microsoft Excel courses give you practical skills you can use immediately.
Looking to upskill your whole department? We offer tailored corporate training solutions designed specifically for your organisation’s unique needs.
From finance and sales teams to HR and operations, we help your people create clean, credible, and professional Excel reports that drive better decisions!
Speak to our course consultants or explore our Excel courses today!
Related Courses
- Data Analysis with Microsoft Excel DASHBOARD Reporting for Management
- WSQ Data Visualisation and Storytelling with Power BI
- WSQ Data Visualisation and Storytelling with Tableau
◆◆◆
Related Articles
Article Topics
- Why Professional Excel Report Matters
- Mistake 1: Inconsistent Formatting
- Mistake 2: Using Too Many Colours and Borders
- Mistake 3: Merging Cells in Tables
- Mistake 4: Hardcoding Numbers in Formulas
- Mistake 5: Not Checking Formulas Before Sharing
- Mistake 6: Mixing Data Formats in the Same Column
- Mistake 7: Leaving the Data Messy Before Building the Report
- Mistake 8: Using Unclear Headers and Labels
- Mistake 9: Creating Confusing Charts
- Mistake 10: Not Including a Summary
- Quick Checklist Before Sharing Your Next Excel Report
- Wrapping Up: Small Fixes, Big Impact