
In a world obsessed with AI and complex data science tools, you might think the humble spreadsheet has had its day. But look at any job board for Finance, HR, Marketing, or Operations, and you’ll find one constant: Excel skills are non-negotiable.
The hiring reality is that employers aren’t just looking for “tech-savvy” people; they want teammates who can handle information quickly and reliably.
Whether you are a student, a career switcher, or an early-career professional, Excel is your most powerful transferable skill.
It bridges the gap between different departments and industries, proving you can add value to any team from day one.
In this guide, we’re going to look at:
- The “Must-Have” Skills: Which specific Excel tools, from PivotTables to Power Query, actually move the needle on your employability.
- The Employability Edge: Why being “good at Excel” signals structured thinking and attention to detail to a hiring manager.
- Proof of Competence: How to demonstrate your skills on a resume and through mini-projects, even if you don’t have prior office experience.
Before we look at the specific formulas you need, let’s explore why this decades-old tool still dominates even the most modern, high-tech workplaces.
Why Excel Still Matters in a Tool-Heavy Job Market
You’ll often find that even in companies with million-dollar software stacks, the most critical work happens after someone clicks the “Export to Excel” button.
We call Excel the “last-mile” tool. While big platforms are great at storing data, Excel is where that data is actually tracked, analysed, and transformed into something a human can understand.
Think about the modern workflow in almost any office:
- Systems: Data is pulled from large corporate platforms.
- Exports: Information is moved into a spreadsheet format.
- Cleaning: Messy formatting is fixed and errors are removed.
- Summaries: Raw data is turned into usable, decision-ready reports.
- Sharing: Insights are distributed to the team or management.
The reason it hasn’t been replaced is simple: speed. Excel allows you to turn raw, overwhelming exports into sharp, usable summaries that support faster business decisions.
When a manager needs an answer now, they don’t want to wait for a software developer to build a new dashboard; they want the team member who can manipulate a spreadsheet to give them a clear picture in minutes.
But beyond just being a tool for speed, the way you use Excel tells a story about how you think and work.
The Employability Edge: What Excel Signals to Employers
Proficiency in Excel signals much more than just “software knowledge” to a hiring manager. It acts as a direct reflection of your structured thinking, attention to detail, and ability to deliver reliable results.
When you submit a clean, functional workbook, you are sending powerful “trust signals” that prove you are ready for the professional world.
Trust Signals Employers Notice
Hiring managers don’t just look at your formulas; they look at how you build your files. High-value candidates stand out by demonstrating these habits:
- Reliable Structure: You build readable spreadsheets that others on the team can use or update without the whole thing breaking.
- Error Reduction: You minimise mistakes by using consistent structures, data validation habits, and simple internal checks.
- Clarity over Complexity: You turn raw numbers into actual insights using clear visuals and summaries rather than just dumping overwhelming tables onto a stakeholder’s desk.
Reinforcing Speed and Professionalism
Beyond accuracy, being “good at Excel” is about how you handle the pressure of a live business environment.
- Efficient Workflows: By using shortcuts and optimised workflows, you can respond faster to urgent business requests.
- Professional Delivery: A well-organised file shows that you respect the time of the person reviewing it, marking you as a professional who is ready for more responsibility.
By mastering these signals, you move beyond just “entering data” and start becoming a key part of your team’s decision-making process.
Excel Skills Ladder That Maps to Better Roles and Pay
In the Singapore job market, employers don’t just pay for what you know; they pay for the level of responsibility you can handle.
Your Excel proficiency is a direct roadmap for moving from basic administrative support to high-value “decision support” roles that command better pay.
Think of your Excel journey as a ladder. As you climb, your output shifts from simply managing numbers to helping your manager or director make the right call.
Level 1: Beginner – Organised Execution
At this stage, you focus on tracking data and keeping consistent records using basic calculations like SUM or AVERAGE.
- Workplace Outcome: You ensure the team’s basic data is accurate, tidy, and ready for use.
- The Signal: You are reliable and can be trusted with the “inputs” of the business.
Level 2: Intermediate – Insightful Reporting
This is where you move beyond “listing” data to summarising trends. You use PivotTables, XLOOKUP, and SUMIFS to compare and present information.
- Workplace Outcome: You can answer “how are we doing?” by turning raw lists into readable reports.
- The Signal: You can connect different sets of data to tell a story.
Level 3: Advanced – Decision Support
At the top of the ladder, you work with larger datasets and use Power Query, scenario modelling, and light automation.
- Workplace Outcome: You eliminate manual “grunt work” and build models that predict future business outcomes.
- The Signal: You are a “solution architect” who provides the logic for big strategic moves.
Moving Beyond “Data Entry”
In many local SMEs and MNCs, the difference between a junior executive and a senior specialist is how they handle information.
By levelling up, you effectively trade manual labour for analytical value. You move from being the person who “types the data” to the person who “explains what the data means,” making you an indispensable asset in any office.
The Most Valuable Excel Skills Employers Look For
In a real workplace, employers aren’t looking for someone who knows every single button in the ribbon. They are looking for the “Workhorse Skills”; the specific functions that allow you to complete tasks accurately and without constant supervision.
If you want to move from “basic user” to “top-tier candidate,” focus on mastering these five areas:
Data Structure and Cleanliness
The foundation of any good report is how you organise the data. Employers value candidates who use Structured Tables, consistent formats, and clear, professional labels. A clean dataset means fewer errors and faster analysis later on.
Core Logic and Formulas
You need to be able to “talk” to your data. This means mastering:
- Conditional Logic: Using IF statements to categorise information.
- Math with Criteria: Using SUMIFS and COUNTIFS to total up numbers based on specific categories, like “Sales in Q3” or “HR Headcount in Singapore”.
- Text & Date Basics: Cleaning up names or identifying deadlines using TEXT and DATE functions.
Lookups and Summaries
This is where the magic happens.
- Lookups: Using XLOOKUP (or the classic VLOOKUP) to connect information across different sheets, like matching an Employee ID to a name.
- PivotTables: These are the ultimate tool for fast summaries, allowing you to turn thousands of rows of data into a neat table in seconds.
Visual Scanning and Reporting
Busy managers don’t have time to read every cell.
- Conditional Formatting: Use this to automatically highlight “outliers”, like a budget that has gone into the red or a task that is past its deadline.
- Charts & Dashboards: Build clear, visual reports that tell a story at a glance.
Red Flags: Common Mistakes That Kill Your Credibility
Even if your formulas are clever, certain “bad habits” can make an employer lose trust in your work instantly:
- Hard-coded numbers: Typing “100” directly into a formula instead of referencing a cell. If the data changes, your formula becomes wrong.
- Messy Tabs & Unclear Headers: If a colleague can’t understand your sheet at a glance, it’s not a professional workbook.
- Inconsistent Formats: Mixing dates (e.g., DD/MM vs MM/DD) or fonts makes the work look amateur.
- Broken References: Leaving #REF! errors in your file signals that you didn’t check your work before sending it.
By avoiding these pitfalls and focusing on the core toolkit, you prove that you aren’t just an Excel user; you are an Excel professional.
Real-World Use Cases Across Common Job Functions
Excel isn’t just a “box to check” on your resume; it is the engine that powers daily deliverables across every department in Singapore.
To truly stand out, you need to stop thinking about “formulas” and start thinking about “outputs” that help your stakeholders make decisions.
Here is how Excel skills translate into actual workplace tasks across different roles:
Operations & Logistics
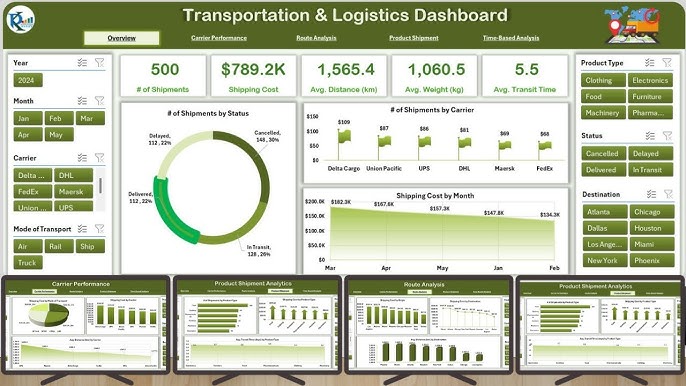
Example of Transportation & Logistics Dashboard(Source: PK An Excel Expert)
In the fast-paced world of operations, Excel is used to keep the wheels turning.
- Trackers: Building real-time logs to monitor inventory or shipment status.
- SLA Reporting: Using formulas to calculate if service level agreements are being met.
- Weekly Summaries: Consolidating daily logs into a high-level report for management.
Finance & Accounting
Example of Budget vs Actual Forecasts in Excel(Source: Flevy)
For finance professionals, Excel is the primary tool for accuracy and forecasting.
- Budget vs. Actuals: Comparing what was planned against what was actually spent using variance analysis.
- Variance Summaries: Highlighting exactly where and why a department went over budget.
- Forecasting Models: Building basic “what-if” scenarios to predict future cash flow or expenses.
HR & Administration
HR teams rely on Excel to manage the most important asset: people.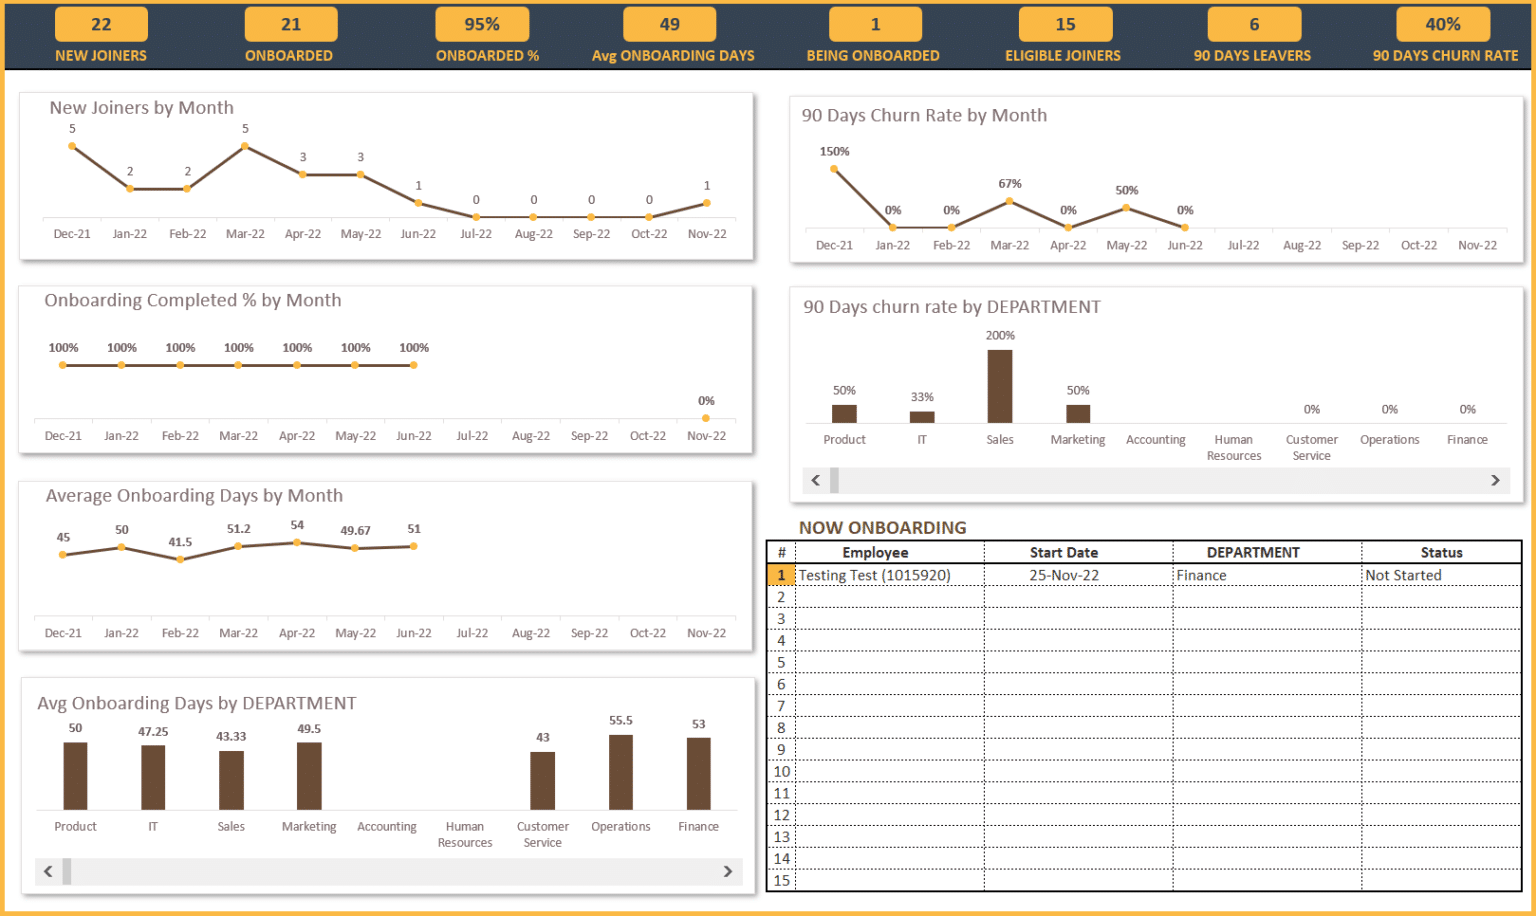
Example of HR Onboarding Dashboard in Excel(Source: Eloquens)
- Onboarding Trackers: Ensuring every new hire completes their necessary paperwork and training.
- Compliance Lists: Tracking mandatory certifications to ensure the company stays audit-ready.
- Headcount Tracking: Using PivotTables to break down staff numbers by department, role, or location.
Marketing & Sales
In sales-driven roles, Excel is used to prove the ROI of every dollar spent.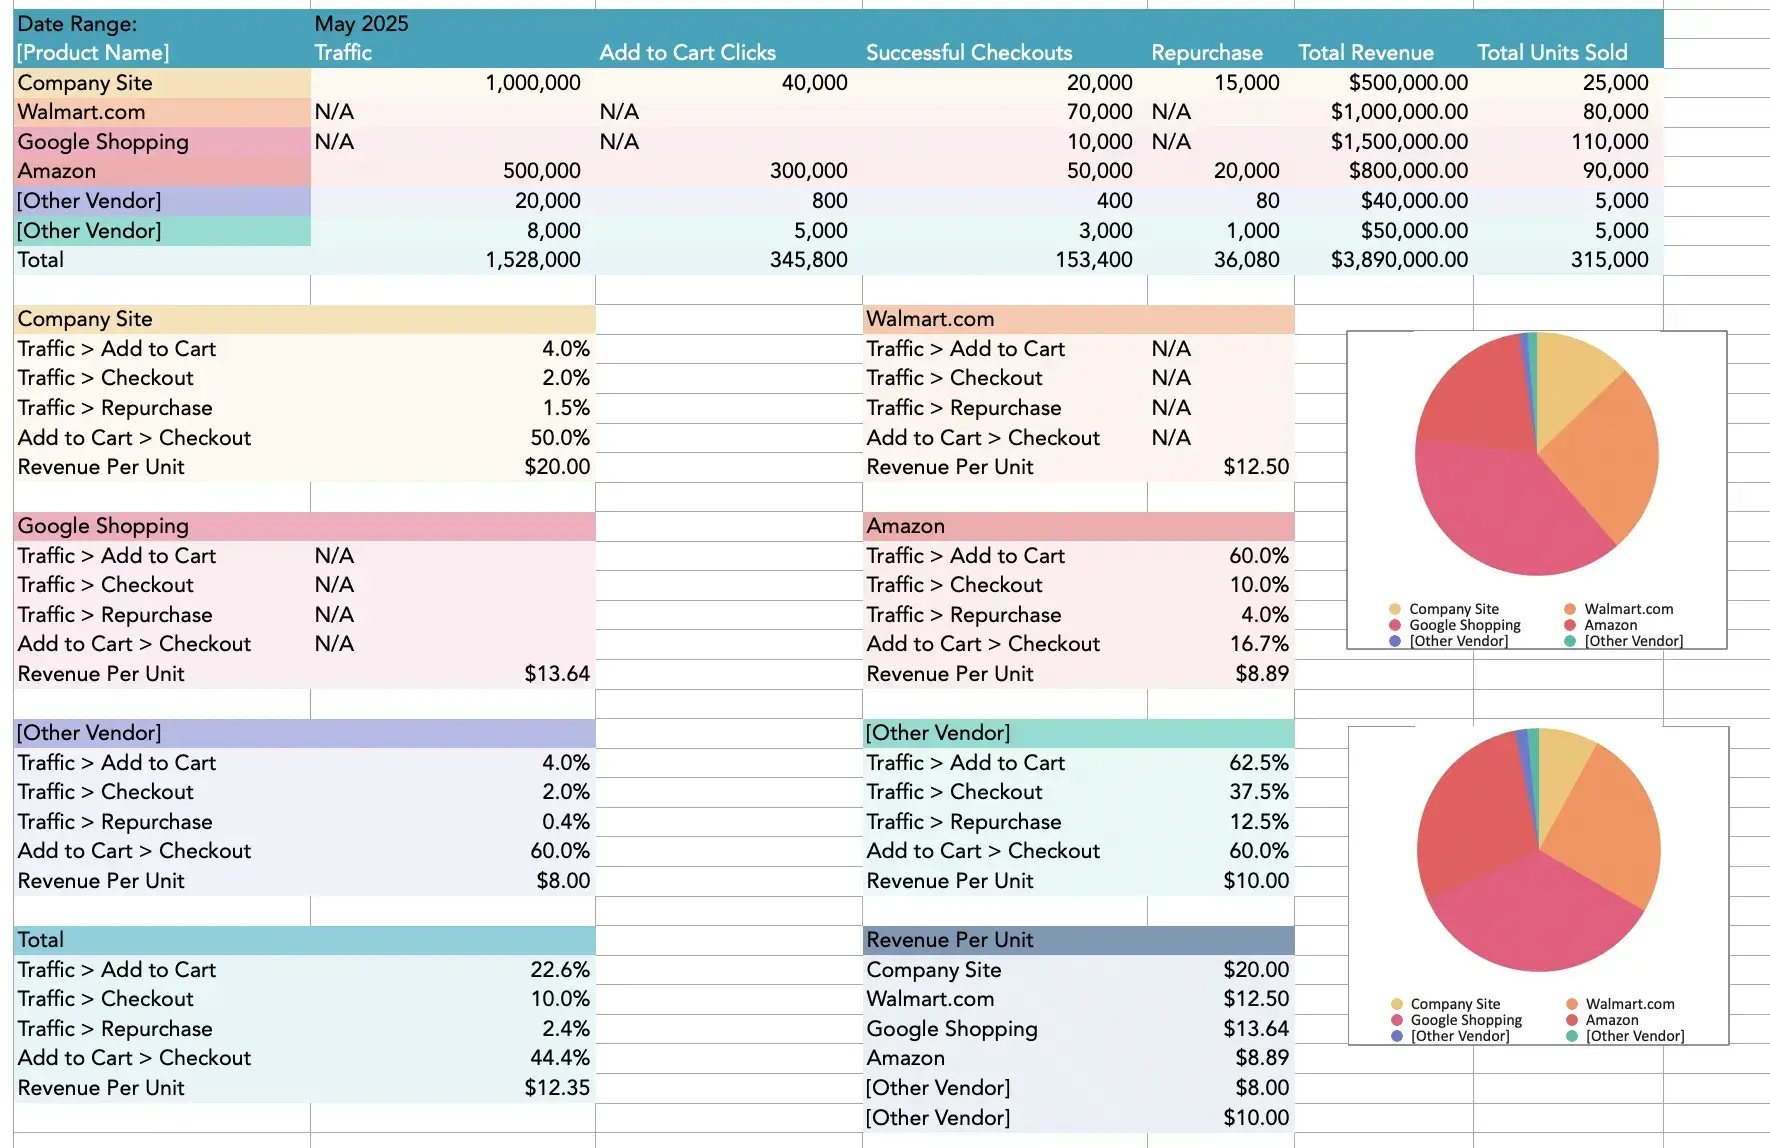
Example of Marketing & Sales Dashboard in Excel
(Source: HubSpot)
- Campaign Summaries: Pulling data from social media or Google Ads to see which campaigns converted best.
- Lead Lists: Cleaning and organising potential customer data to help the sales team prioritise calls.
- Pipeline Reporting: Visualising the “sales funnel” to show how many deals are close to signing.
No matter your target role, the goal is always the same: turn raw data into a clear story that helps your manager make a faster, better decision.
Modern Excel: Power Query, Dashboards, and Light Automation
If you want to truly stand out in the Singapore job market, you need to move beyond basic formulas and embrace Modern Excel.
These are the tools that transform you from a “spreadsheet user” into a “workflow optimiser”; someone who can save the company hours of manual work every week.
Power Query: The Secret Weapon for Efficiency
Most of your time in a typical office is spent cleaning messy data exports from old systems. Power Query is a game-changer because it allows you to:
- Clean data consistently: You can set up a series of “steps” to fix messy columns, remove blanks, or fix date formats once, and Excel will repeat those steps every time you hit “Refresh”.
- Combine multiple sources: It allows you to grab data from different folders or files and merge them into one single, usable table automatically.
- Improve your employability: Showing you know Power Query tells an employer you won’t waste three hours every Monday morning doing manual “copy-paste” work.
Dashboards as Professional Communication
In a fast-paced business environment, your boss doesn’t want to see 50 tabs of data; they want a Dashboard. High-impact dashboards focus on:
- Key Metrics: Choosing a few vital numbers (like monthly sales growth or project completion rates) and presenting them clearly.
- Quick Reading: Using visuals so that stakeholders can understand the “health” of the business in under 30 seconds.
- Interactive Slicers: Allowing users to filter data by region or department with a single click, making your reports look highly professional.
Light Automation: Working Smarter, Not Harder
Automation doesn’t always mean complex coding or VBA. Modern Excel allows for “Light Automation” through:
- Structured Tables: Using tables that automatically expand when you add new data.
- Repeatable Templates: Designing files where you simply drop in a new data export and the formulas do the rest.
- Simple Macros: Recording basic steps to handle repetitive formatting tasks at the touch of a button.
By mastering these modern features, you aren’t just “using Excel”; you are building systems that make you the most efficient person in the room.
However, having these skills is only half the battle; you also need to know how to showcase them so that hiring managers actually notice your potential.
How to Prove Excel Skills on Your Resume Even Without Experience
In the competitive Singapore job market, simply listing “Proficient in MS Excel” on your CV isn’t enough anymore.
Recruiters see that on almost every application. To truly stand out, you need to provide proof over claims. You want the hiring manager to look at your resume and think, “This person can actually solve our reporting problems.”
The best way to do this, especially if you are a fresh graduate or a career switcher, is to build mini-projects that mirror real workplace reporting.
Building Your “Proof” Portfolio
When you build these projects, remember that the file itself is a reflection of your work ethic. If you ever show these files in an interview:
- Stay Organised: Use clear tab names (e.g., “Data_Entry,” “Calculations,” “Final_Dashboard”).
- Keep it Readable: Use consistent fonts, professional colours, and clear headers.
- Make it Easy to Follow: Include a “Read Me” or “Instructions” tab that explains what the file does and how the data flows.
Outcome-Focused Resume Bullets
Don’t just list your skills; describe the impact those skills have. Use these templates to upgrade your resume:
- Efficiency: “Reduced weekly reporting time by 30% by developing repeatable templates and utilising PivotTables for rapid data summarisation.”
- Accuracy: “Improved data integrity and reduced manual errors by replacing manual calculations with automated formulas and structured references.”
- Communication: “Designed dynamic dashboards that highlight key business exceptions and trends, allowing stakeholders to quickly interpret insights and make data-driven decisions.”
- Modern Workflow: “Standardised monthly data cleaning steps using Power Query, ensuring consistent and error-free reporting across different data sources.”
- Automation: “Streamlined recurring processes by automating data imports, transformations, and report generation, saving several hours per cycle and enabling stakeholders to receive insights faster.”
5 Portfolio-Ready Mini-Project Ideas
If you’re looking for a place to start, try building one of these three projects this weekend:
- Sales Performance Report
- Budget Tracker
- HR Analytics Snapshot
- Customer Churn Dashboard
- The “Data Cleaner”
Use a sample dataset to create a report that tracks sales by region, product, and month using PivotTables and interactive charts.
Build a tracker that compares “Planned vs. Actual” spending, using Conditional Formatting to create “variance flags” that turn red when you’re over budget.
Create an HR dataset and analyse headcount, turnover rate, hiring pipeline, and absenteeism.
Use PivotTables, sparklines, and Conditional Formatting to present a clean “Executive HR Summary” that mirrors real business reporting.
Import a customer dataset and build a dashboard that highlights churn trends using KPIs, segmentation slicers, and a simple retention forecast showing how you can turn raw customer behaviour data into actionable insights.
Take a messy, unformatted dataset and use Power Query to shape it into a clean, refreshable report. This proves you can handle the “dirty work” of data management.
By creating these tangible examples, you transform “Excel” from a bullet point into a proven professional asset.
Now that you have the roadmap to prove your competence, let’s wrap up with the next steps you can take to secure your next role.
Wrapping Up: Your Roadmap to Workplace Readiness
In a job market as competitive as Singapore’s, your technical skills are your strongest currency.
As we’ve explored, Excel isn’t just about filling cells with numbers; it’s about boosting your speed, ensuring your accuracy, and providing clarity to your team.
Whether you are aiming for a role in a CBD-based MNC or a growing local SME, these are the traits that make a candidate truly employable.
To turn Excel into your professional edge, remember the roadmap we’ve discussed:
- Learn High-Impact Skills: Focus on the “workhorse” tools like XLOOKUP, PivotTables, and Power Query.
- Practice with Realistic Tasks: Don’t just watch tutorials; apply what you learn to messy, real-world data.
- Show Your Proof: Use outcome-focused resume bullets and build a small portfolio of work that speaks for itself.
Your Next Step: Start Building Today
Don’t wait for a job offer to start practising. The best way to master Excel is to solve a problem with it right now.
Pick one mini-project aligned with your target role:
- For Sales/Marketing: Build a campaign performance dashboard with charts.
- For Finance/Admin: Create a budget vs. actuals tracker with variance flags.
- For Operations: Use Power Query to clean a messy dataset into a refreshable report.
Pick your project, build it end-to-end, and you’ll walk into your next interview not just saying you know Excel, but proving it!
Looking to Fast-Track Your Excel Skills?
Whether you’re looking to master your first XLOOKUP or want to lead with data insights, our hands-on Microsoft Excel courses are designed to make you workplace-ready from day one.
Explore our range of Excel courses from beginner to advanced, or level up with our Professional Certificate in Business Analytics and Statistics with Excel to prove you’ve got the skills that modern employers demand.
Speak to our course consultant and enrol with us today!
Related Courses
- Introduction to Microsoft Excel Power Query, Data Model, Power Pivot & DAX
- Bridging Big Data Analytics using Excel & Power BI
- Professional Certificate in Business Analytics & Statistics with Excel
◆◆◆
Related Articles
Article Topics
- Why Excel Still Matters in a Tool-Heavy Job Market
- The Employability Edge: What Excel Signals to Employers
- Excel Skills Ladder That Maps to Better Roles and Pay
- The Most Valuable Excel Skills Employers Look For
- Real-World Use Cases Across Common Job Functions
- Modern Excel: Power Query, Dashboards, and Light Automation
- How to Prove Excel Skills on Your Resume Even Without Experience
- Wrapping Up: Your Roadmap to Workplace Readiness