Ever wondered how businesses predict what will happen in the future? How do they know how much of a product to order, when to run a sale, or how many staff to schedule?
This is where time series forecasting stands out as a critical technique for making data-driven decisions. This approach is like tracking something over time, such as the daily temperature, monthly sales of a product, or the number of visitors to a website each week.
This is called “time series” data. Time series forecasting is about looking at past data to make educated guesses about what might happen next.
Even if you’re using tools like Microsoft Excel, simple functions such as trendlines and forecasting sheets can help you achieve this without the need for advanced coding skills.
Accurate forecasting is not just a technical exercise; it’s a cornerstone of strategic decision-making, helping organisations use their resources wisely, meet demand, and stay competitive.
In Singapore, where industries such as finance, logistics, and retail thrive on data-driven insights, time series forecasting has become a vital tool for ensuring operational efficiency and staying ahead of market trends.
For example, businesses here utilise time series models to align inventory with festive demand surges like Chinese New Year or prepare for fluctuations during the annual Great Singapore Sale.
In this article, we’ll explore how time series forecasting works, look at some common methods, and its significance in predictive analytics. Our goal here is to provide useful information for anyone interested in data, whether you’re a data scientist, a business professional, or just curious about how predictions are made.
What is Time Series Forecasting
Time series forecasting is a statistical technique used to predict future values based on historical time-stamped data. It involves analysing patterns and trends in past data points collected over time to develop a model that can predict those patterns in the future.
In simpler terms:
Imagine you’re tracking the number of ice cream cones sold at a shop every day. This is your “time series” data – data collected over time. Time series forecasting is like trying to guess how many ice cream cones you’ll sell tomorrow based on how many you’ve sold in the past.
Understanding Time Series Forecasting
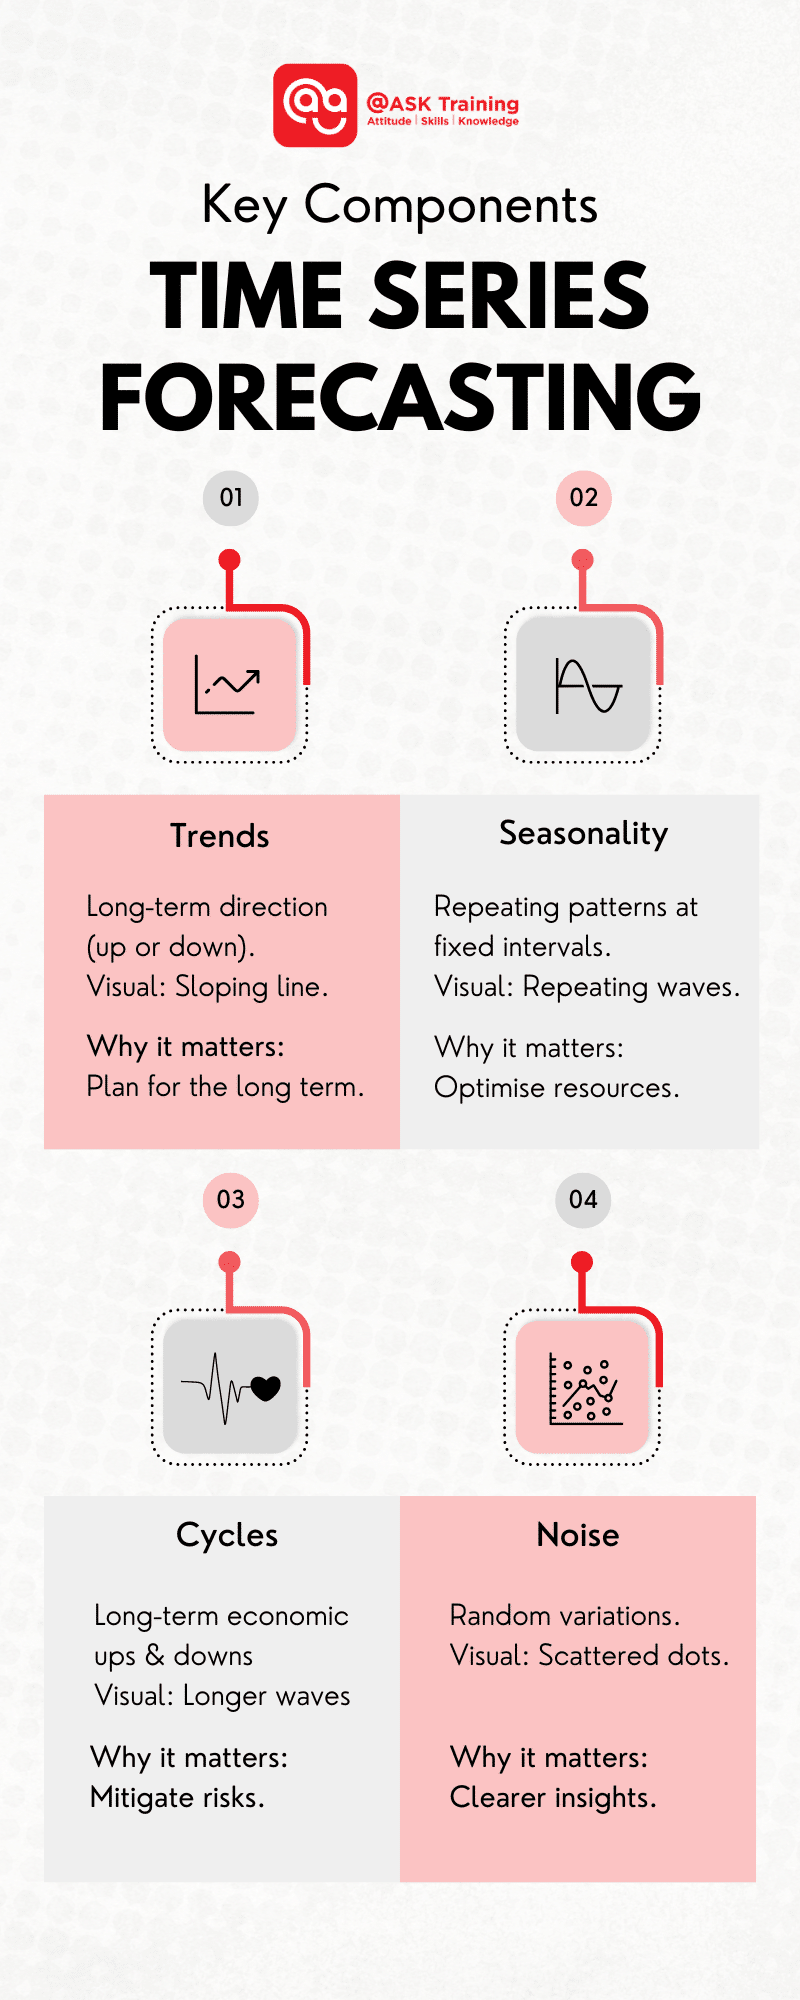
Time series forecasting is a method used to predict future data points by analysing patterns in a sequence of historical data. The key components of time series include:
Trends
Long-term movements in data, such as consistent growth or decline. Identifying data trends helps businesses plan for sustained changes over time, such as market growth or decline.
In other words, these are long-term ups or downs in the data. Think of it as a general direction. Singapore’s property market, for instance, relies on trend analysis to project housing demands.
Example: If a company’s sales have been steadily increasing every year for the past ten years, that’s an upward trend. Or, if a population of a certain bird species has been steadily declining, that’s a downward trend.
Seasonality
Regular patterns that occur at specific intervals, such as monthly sales spikes. Like seasons of the year, these are regular, repeating patterns that happen within a fixed period. Recognising seasonality ensures better resource allocation and promotional planning.
For example, Singaporean retailers optimise staffing and stock levels during events like the 11.11 shopping festival.
Cycles
These are also ups and downs, but they happen over much longer periods than seasonality, and they aren’t as regular. They’re often tied to the overall economy.
Understanding cycles can help in strategic planning and risk mitigation, such as planning for cyclical slowdowns in global trade affecting Singapore’s ports.
Example: Image tracking daily website visits. One day, a celebrity mentions your website on social media, leading to a huge, unexpected spike in traffic. This spike is noise because it’s a one-off event and not part of any regular pattern.
Another example might be a sudden power outage that affects sales for a single day.
Forecasting is indispensable for businesses across sectors. Whether estimating sales, forecasting stock prices, or predicting demand, time series analysis enables organisations to make informed decisions based on historical trends.
With a solid grasp of these components, you can begin exploring the specific methods used to create accurate forecasts.
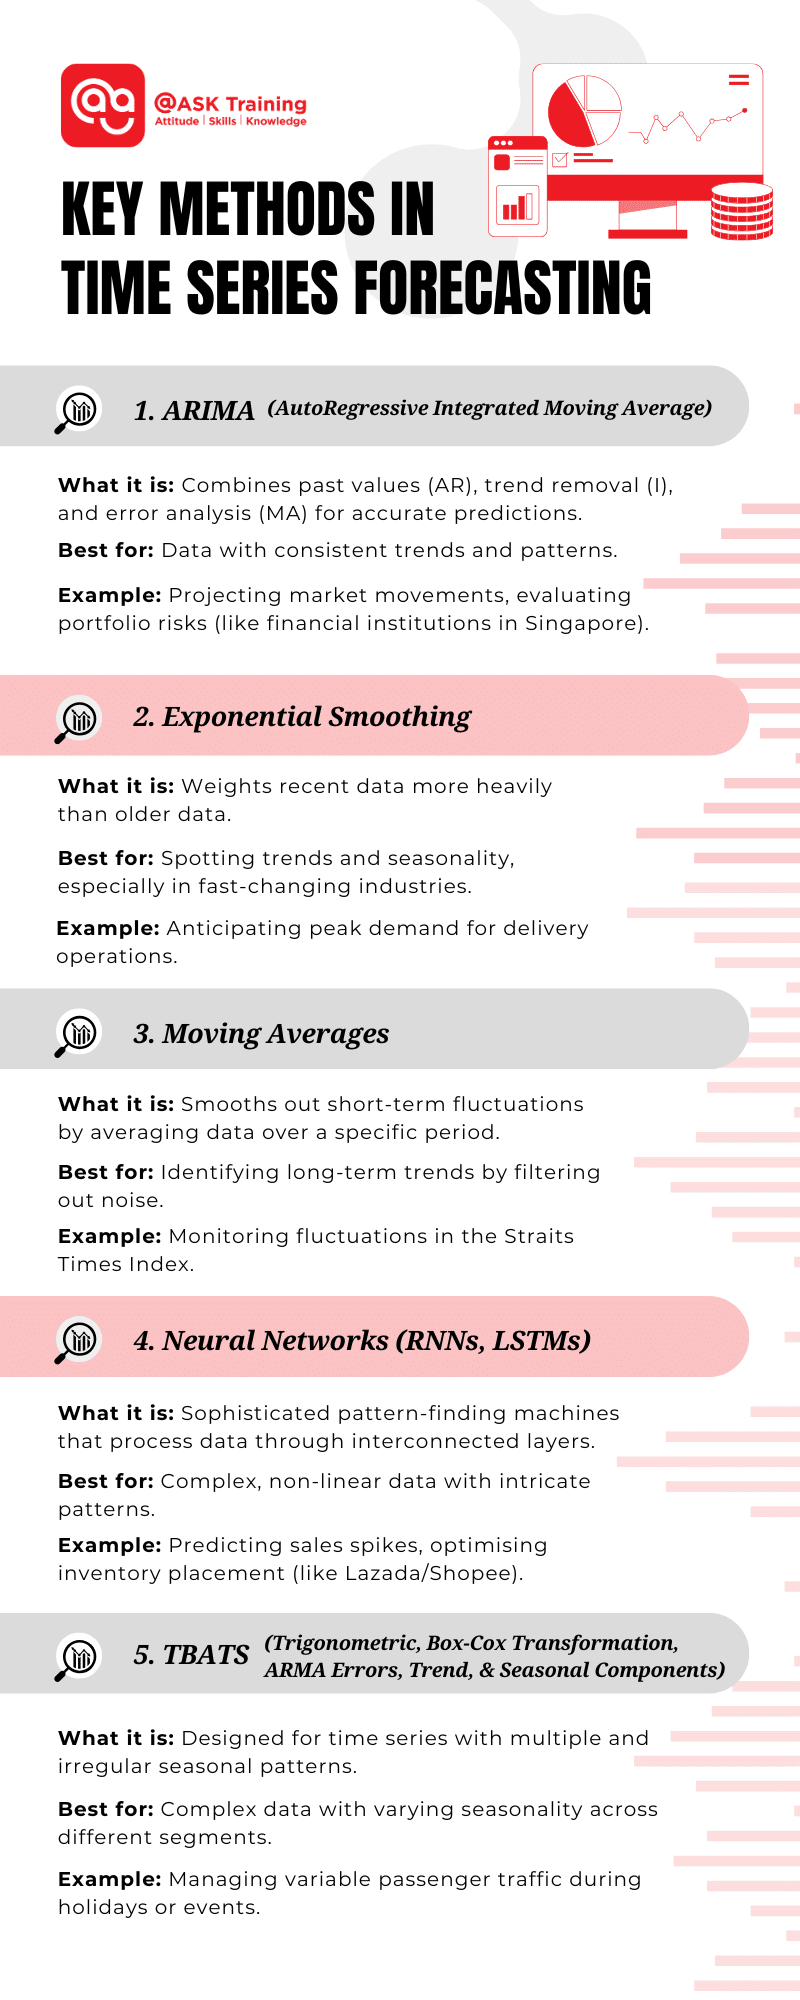
Key Methods in Time Series Forecasting
Let’s explore some common ways to predict the future using time series data. These are like different tools in a toolbox, each with its own strengths.
ARIMA (AutoRegressive Integrated Moving Average)
ARIMA is a widely used model for time series forecasting that combines three components:
AutoRegressive (AR)
Relies on the relationship between a data point and its previous values. This part looks at how much a value depends on its own past values. Think of it like saying, “If sales were high yesterday, they’re likely to be somewhat high today too.”
Integrated (I)
Applies differencing to make a non-stationary series stationary by removing trends. Sometimes, data has a trend that makes it hard to analyse directly. This part uses a technique called “differencing” to remove that trend, making the data easier to work with.
Imagine you’re tracking a climbing staircase. Differencing is looking at how much you go up each step instead of your total height.
Moving Average (MA)
Accounts for the dependency between an observation and residual errors from previous forecasts. This considers past “errors” in our predictions. If we underestimated sales yesterday, this part helps us adjust our prediction upwards for today.
By combining these components, ARIMA effectively models data with consistent trends or patterns.
ARIMA Model Visualisation (Source: KDnuggets)
While ARIMA is often implemented using programming languages like Python, you can also apply its core concepts using Excel’s built-in forecasting features, such as the Data Analysis Toolpak. By combining these components, ARIMA effectively models data with consistent trends or patterns.
Your organisation can use ARIMA to project market movements and evaluate portfolio risks, just as financial institutions in Singapore do. For a deeper dive, visit this detailed guide.
As you explore ARIMA, it’s also helpful to compare it with other methods that may better suit your data.
Exponential Smoothing
Exponential smoothing gives more weight to recent data points and less weight to older ones. It’s like saying, “What happened last week is more important than what happened last year.”
This method is especially useful for spotting trends and seasonality while ignoring random noise. Because it focuses on recent changes, it’s good for industries like retail and logistics, where things can change quickly.
For instance, your delivery operations can leverage exponential smoothing to anticipate peak demand times and optimise resource allocation.
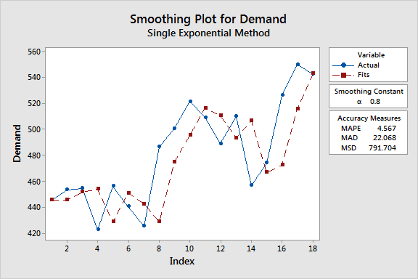
Exponential Smoothing Visualisation
Learn more in this beginner’s guide or try out Microsoft’s Excel’s Forecast Sheet that allows for easy implementation of exponential smoothing forecasts without advanced coding skills.
To further refine your understanding, consider methods like moving averages for simpler trend detection.
Moving Averages
Moving averages smooth out short-term fluctuations by calculating the average of different subsets of the dataset over a specified period. Imagine plotting the average temperature over the last 7 days instead of the temperature each individual day. This smooths out daily fluctuations and shows the overall trend.
This method helps you see the bigger picture by filtering out random noise. It’s a simple but powerful tool for finding trends in things like stock markets and sales data.
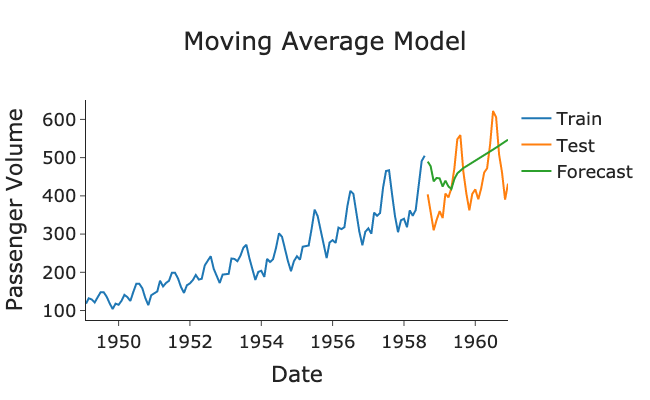
Moving Average Model Example (Source: Towards Data Science)
For example, analysts in Singapore frequently use moving averages to monitor fluctuations in the Straits Times Index.
Moving averages can be easily calculated in Excel to smooth out short-term fluctuations and highlight longer-term trends. Explore further in this simple guide by Real Statistics Using Excel.
For more complex patterns, neural networks offer advanced capabilities.
Neural Networks
Neural networks, particularly Recurrent Neural Networks (RNNs) and Long Short-Term Memory (LSTM) networks are powerful tools for modelling nonlinear and complex time series data. You can think of them as very sophisticated pattern-finding machines.
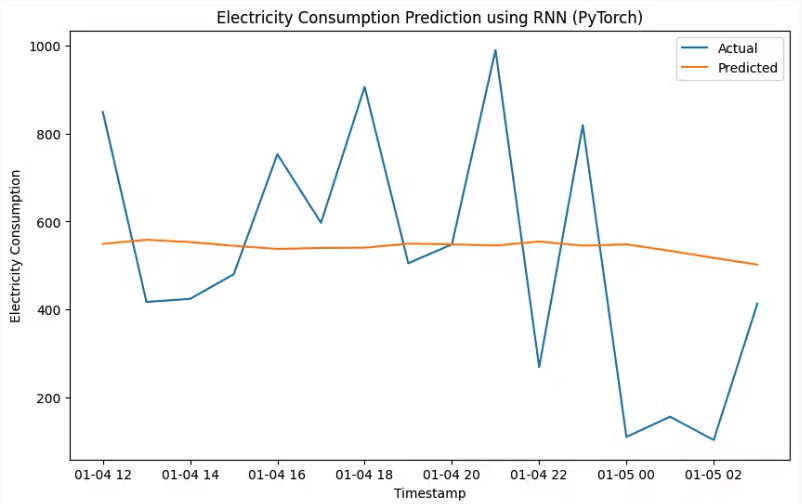
Recurrent Neural Networks RNN (Source: Encord)
They process input data through interconnected layers:
- Input Layer: This receives the time series data, where the data goes in.
- Hidden Layers: These layers work behind the scenes to find patterns in the data, where the magic happens.
- Output Layer: This produces the forecasted values, where the prediction comes out.
These models are great at handling large and complex datasets. For your e-commerce operations, neural networks can predict sales spikes and optimise inventory placement, just as platforms like Lazada or Shopee do.
For beginners who are interested in exploring this advanced method, check out this simple guide on implementing simple neural network directly in Excel.
When faced with irregular seasonality, consider TBATS as a specialised solution.
TBATS (Trigonometric, Box-Cox Transformation, ARMA Errors, Trend, and Seasonal Components)
TBATS is designed for time series with multiple and irregular seasonal patterns. Imagine trying to predict sales for a store that has different seasonal patterns in different regions. TBATS is designed for this kind of complexity.
It uses advanced techniques to model very complicated data, such as retail sales across different areas with different seasonal trends.
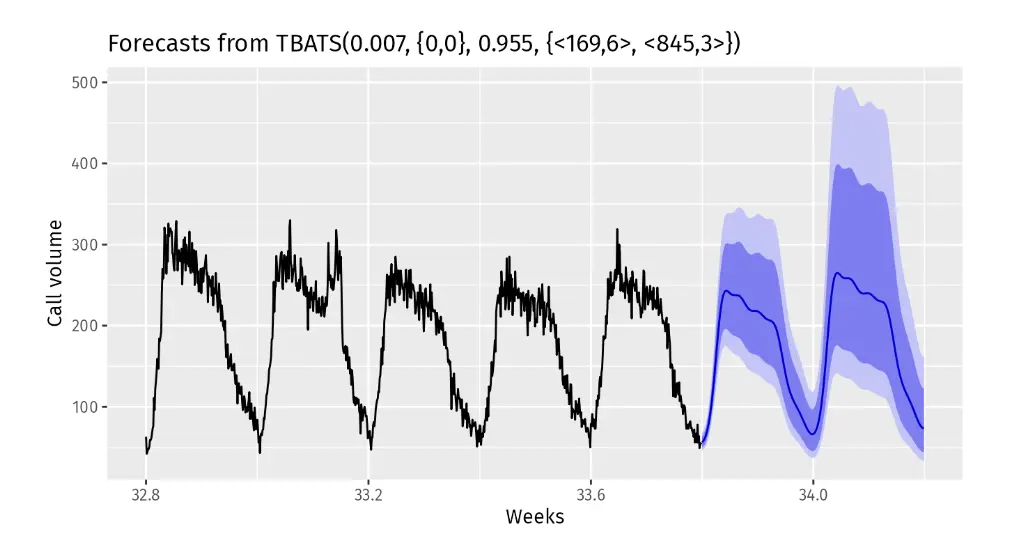
TBATS Time-Series Forecasting Example (Source: Timescale)
For instance, TBATS could help your organisation manage variable passenger traffic during holidays or major events like the Singapore Airshow.
For more about TBATS, visit this resource.
With a firm grasp of these methods, it’s essential to ensure your data quality and volume support accurate forecasting.
Importance of Data Quality and Volume
The accuracy of any forecasting model depends heavily on the quality and amount of data you have. High-quality data ensures that the patterns identified are real.
Key preprocessing steps include:
- Handling Missing Data: If some data is missing, we need to fill it in or remove it so it doesn’t mess up your predictions
- Ensuring Data Consistency: We need to make sure the data is in a consistent format so we can compare it easily.
- Identifying and Removing Outliers: We need to find and remove any unusual data points that could throw off our results.
Volume is equally critical. Larger datasets provide more context, enabling models to better capture trends, cycles, and seasonality.
In Singapore, the Smart Nation initiative promotes robust data collection and sharing, creating vast opportunities for accurate forecasting to benefit your organisation. Before applying forecasting methods, you must also ensure your data is stationary.
Achieving Stationarity in Time Series Analysis
Stationarity is a very important idea in time series analysis. It means that the data’s basic characteristics – like its average value (mean) and how spread out it is (variance) – stay the same over time.
Imagine a flat line on a graph. If the line is constantly going up or down, or if the spread of the data keeps changing, it’s not stationary.
Why is this important? Many forecasting methods work best with stationary data. It makes the math simpler and gives us more reliable results. It’s like building a house on a stable foundation. If the ground is constantly shifting, the house won’t be stable.
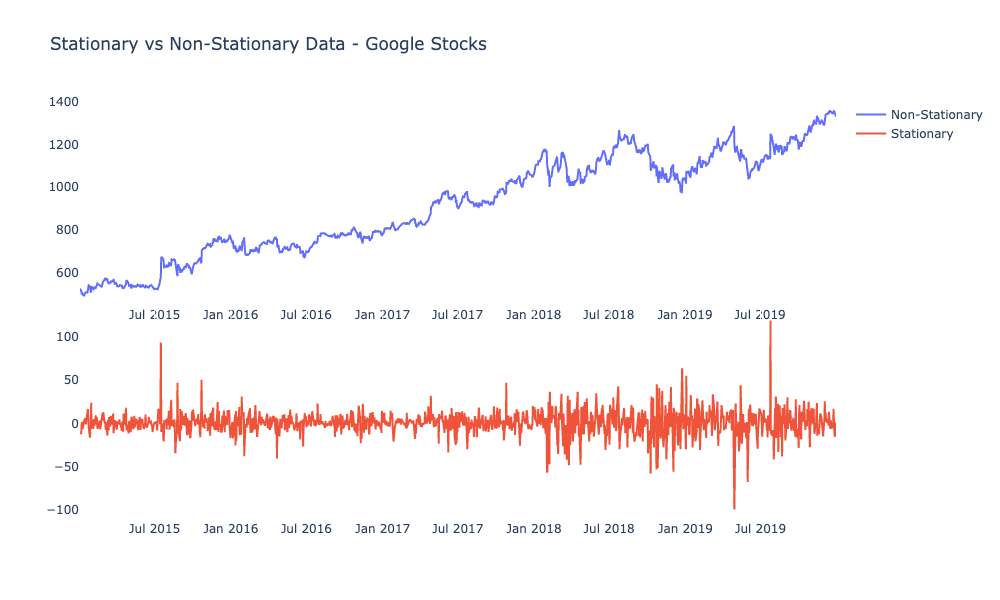
Stationary vs Non-Stationary Data Example
(Sources: Cisco)
Here are some common techniques to make data stationary:
Differencing
As mentioned earlier in ARIMA, this is finding the change between each data point. Mathematically, you subtract the previous value from the current value. This helps to remove trends (upward or downward movements) and make the average value more stable.
Example: Let’s say you’re tracking the height of a plant that’s growing. Instead of tracking its total height each day, you track how much it grew each day. This focuses on the change, not the overall upward trend.
Transformation
Sometimes, the spread of the data (variance) changes over time. Transformations, like taking the logarithm or square root of the data, can help make the spread more consistent.
Example: Imagine you’re tracking website traffic. If you get a few very large spikes in traffic, it can make the data look very uneven. Taking the logarithm can “compress” these spikes and make the data more manageable.
These methods allow you to prepare your data for advanced forecasting techniques. We want our data to be ‘stable’ before we try to predict the future. Differencing helps stabilise the average value and transformations help stabilise how spread out the data is.
For an in-depth exploration, read this blog on stationarity.
Once your data is ready, you can explore its applications across various industries.
Applications of Time Series Forecasting
Time series forecasting is utilised across industries. Here are a few examples:
Finance
When trying to decide whether to invest in a particular stock, you’d want to know if its price is likely to go up or down. Here’s where time series forecasting can be applied.
By analysing past stock prices and market trends, financial professionals can use forecasting models to predict future price movements, assess investment risks, and plan their investment strategies.
This allows them to make more informed decisions, potentially increasing profits and minimising losses. Financial hubs like Marina Bay in Singapore rely heavily on these techniques to stay competitive in the global market.
Retail
If you’re a store owner trying to decide how much inventory to order for the upcoming holiday season, ordering too much means wasted money on storage, while ordering too little means lost sales.
This is where time series forecasting comes in. By analysing past sales data, retailers can forecast demand for different products, optimise their inventory levels to meet customer needs without overstocking, and plan effective promotional campaigns.
This leads to improved customer satisfaction, increased sales, and better profitability. For example, retailers in Singapore use forecasting to prepare for major shopping events like the 11.11 sale, ensuring they have enough stock to meet the surge in demand.
Manufacturing
Let’s say you’re a factory manager who needs to schedule production and ensure that machines are running smoothly. Unexpected breakdowns can disrupt production and cost the company money.
Time series forecasting can help prevent these issues. By analysing data on machine performance maintenance history, manufacturers can predict when equipment is likely to require maintenance, plan production schedules accordingly and manage their supply chains more efficiently.
This leads to increased production efficiency, reduced downtime, and lower maintenance costs. Singapore’s industrial estates such as those in Jurong, utilise these techniques to maintain their high standards of manufacturing efficiency.
Understanding these applications highlights the transformative potential of forecasting. However, challenges remain.
Challenges and Limitations
Despite its utility, time series forecasting presents challenges:
Handling Non-Stationary Data
Remember stationarity? Sometimes, data isn’t stable, meaning its average or spread changes over time. This is like trying to predict the path of a bouncing ball – it’s much harder than predicting the path of a ball rolling on a flat surface.
Special techniques are needed to make this kind of data usable, which can be complicated.
Managing Complex Seasonality and Cycles
In some cases, patterns aren’t simple. There might be multiple repeating patterns or long, irregular ups and downs. Imagine trying to predict sales for a toy store that has different sales spikes around different holidays throughout the year.
It’s more complex than just predicting higher sales in December. These complex patterns require more advanced forecasting methods.
Adapting to Unexpected Events
Economic shocks, natural disasters, and other unexpected factors can throw off even the best forecasts. The COVID-19 pandemic is a great example – it made it very difficult to predict anything for a while. These unexpected events can make forecasts inaccurate.
Data is tricky to work with; patterns can be very complicated, and unexpected events can make predictions wrong.
Some practical advice includes:
- Using strong forecasting methods for complex data
- Considering outside factors that might affect the data
- Being flexible in how you approach forecasting
Regularly checking and updating your forecasting models will help your organisation stay adaptable in a changing world. Additionally, using Excel’s Forecast Sheet and PivotTables can help you manage and analyse time series data effectively without extensive technical knowledge.
By facing these challenges head-on, you can create stronger and more reliable forecasting systems.
Wrapping Up
We have reached the end of the article! We’ve explored time series forecasting – a powerful way to predict the future using past data. It’s not just about complicated math; it’s about making smart decisions based on what’s already happened.
By using different tools mentioned earlier such as ARIMA, exponential smoothing, and neural networks, you can find hidden patterns in your data and use them to make better predictions.
Here are some key things to remember:
- Understand the Basics: Learn about the different parts of time series data—trends (long-term direction), seasonality (repeating patterns), cycles (long-term ups and downs), and noise (random fluctuations). These are the building blocks of forecasting.
- Pick the Right Tools: Choose the forecasting method that works best for your data and what you’re trying to predict. If you’re working with financial data, ARIMA might be a good choice. If you have complex seasonal patterns, TBATS might be better.
- Use Good Data: Make sure your data is clean, consistent, and that you have enough of it. Good data is the key to good predictions.
- Be Ready for Challenges: Forecasting isn’t always perfect. Be prepared to handle things like unstable data, complex patterns, and unexpected events. Things don’t always go exactly as predicted, so it’s good to be flexible.
- Use Forecasting Wisely: Apply forecasting to solve real-world problems in areas like finance, retail, manufacturing, and more. Think about how forecasting can help your specific situation.
By incorporating time series forecasting into your analytics toolkit, you can transform raw data into actionable insights that can help you and your organisation succeed.
Tools like Excel and Tableau make it easy to visualise and interpret forecasting results, helping you communicate data-driven insights clearly to your stakeholders. Here’s the summary of the key methods in time series forecasting:
These are all valuable tools in today’s data-driven world. By using them wisely, you can make better decisions and prepare for what’s coming next.
Ready to Enhance Your Skills?
If you’re looking to deepen your understanding of time series forecasting and predictive analytics, @ASK Training offers courses such as:
- Data Visualisation and Storytelling with Tableau: Learn how to transform complex data into compelling visual narratives, an essential skill for presenting time series analysis effectively.
- Data Analysis with Microsoft Excel DASHBOARD Reporting for Management: Learn the art of creating insightful dashboards to interpret and report on forecasting results with clarity and precision.
Get in touch with us today to learn more and take the next step in your analytics journey!