
Most marketing dashboards are too crowded.
They show impressions, clicks, reach, engagement, video views, cost per click, cost per lead, bounce rate, conversion rate, revenue, ROAS, CAC, LTV, and sometimes another 20 numbers nobody really discusses after the meeting.
The problem is not that these numbers are useless. The problem is that many teams report everything without clearly separating what helps them diagnose performance from what actually proves business impact.
For marketers in Singapore, this matters even more. Media costs are competitive, audiences are small, and many businesses do not have unlimited budgets to test and learn forever.
A local SME, training provider, ecommerce brand, SaaS company, clinic, interior design firm, or education business needs to know one thing clearly: is marketing helping the business grow profitably?
That is where marketing performance metrics matter.
Not every metric deserves equal attention. Some metrics tell you whether your ads are visible. Some tell you whether your funnel is working. Some tell you whether your marketing is creating revenue, margin, and long-term customer value.
The key is knowing which is which.
Why Most Marketing Reports Fail to Explain Revenue
Many marketing reports look impressive but fail to answer the most important business question: did the campaign help us make money?
A report may show 800,000 impressions, 12,000 clicks, 1,500 leads, $2.80 cost per lead, and a 4.5% click-through rate. On paper, this looks busy.
But what if only 30 leads were qualified? What if only 5 turned into paying customers? What if the average sale was too small to cover the cost of acquisition?
That is where many reports fall apart.
Key Insight: Activity is not the same as performance. Visibility is not the same as demand. Lead volume is not the same as revenue.
This is especially common in lead generation campaigns in Singapore. A tuition centre, maid agency, renovation company, course provider, or B2B service firm may get many form submissions from Meta ads. Yet the sales team later finds that many leads are price-shopping, unresponsive, or not eligible.
The campaign may look good inside Ads Manager. The business result may still be weak.
This is why marketers need to move beyond surface-level performance marketing metrics and connect reporting to actual sales outcomes.
Vanity, Leading, and Lagging Metrics: What Actually Matters?
One of the biggest mistakes beginners make is treating all marketing KPIs as if they carry the same weight.
They do not.
There are three broad types of metrics:
| Metric Type | What It Shows | Examples | How To Use It |
| Vanity metrics | Visibility and activity | Impressions, reach, likes, page views | Useful for context, but weak for decision-making |
| Leading metrics | Early signs of future performance | CTR, CPC, landing page conversion rate, add-to-cart rate, lead quality signals | Useful for optimisation |
| Lagging metrics | Final business outcomes | Revenue, CAC, ROAS, LTV, retention, profit | Useful for judging real impact |
Vanity Metrics
Vanity metrics are not completely useless. If nobody sees your campaign, nothing else happens. Reach and impressions can help you understand whether your campaign is getting enough delivery.
But vanity metrics should not drive strategy by themselves.
- A post with many likes may not produce enquiries
- A campaign with high reach may not drive sales
- A blog post with high traffic may attract readers who will never become customers
Leading Metrics
Leading metrics are more useful because they give early signals:
- A low CTR may suggest weak creative, weak offer, or poor audience targeting
- A high CPC may suggest intense competition or poor relevance
- A low landing page conversion rate may suggest poor messaging, slow page speed, weak trust signals, or an unclear call to action
- A low add-to-cart rate may suggest poor product-market fit, pricing concerns, or weak product presentation
Lagging Metrics
Lagging metrics tell you what actually happened. Revenue, CAC, ROAS, LTV, retention, churn, and profit are lagging metrics because they usually appear after the user has moved through the funnel.
How Badly Do Lagging Metrics Lag?
The lag depends on the business model.
- For a low-cost e-commerce product, the lag may be short – someone may click an ad and buy within the same day.
- For a higher-ticket purchase, the lag may be much longer – a renovation lead may take weeks or months to become a signed project.
- A B2B software lead may take 3 to 6 months to close.
- A professional course enquiry may take days or weeks depending on funding, schedule, and approval.
This lag affects performance measurement in a few important ways:
1. Early Campaign Data Can Be Misleading
A campaign may look expensive in week one because conversions have not closed yet. If you optimise too aggressively based on early data, you may pause campaigns that would have produced good customers later.
2. Platform Data May Understate the Real Impact of Marketing
A person may first see a Meta ad, later search on Google, compare providers, ask a colleague, and finally convert through direct traffic.
If you only look at last-click attribution, you may over-credit search or direct traffic and under-credit paid social. We will return to attribution models later in this article.
Google Analytics 4 uses data-driven attribution to assign fractional credit based on how touchpoints affect the probability of a key event, rather than giving all credit to the final click. That reflects how modern customer journeys are rarely linear.
3. Lagging Metrics Are Better for Strategic Judgement Than Daily Optimisation.
You should not wait 3 months before changing a bad ad. But you also should not judge a long-sales-cycle campaign only by the first week’s leads.
The practical solution is to use leading and lagging metrics together. Leading metrics help you optimise quickly. Lagging metrics tell you whether the optimisation actually created business value.
The Core Marketing Performance Metrics That Actually Drive Revenue
The best marketers do not track fewer metrics because they are lazy. They track fewer metrics because they know which numbers are worth arguing about.
The most important digital marketing metrics are the ones that connect marketing activity to revenue, profitability, and customer value.
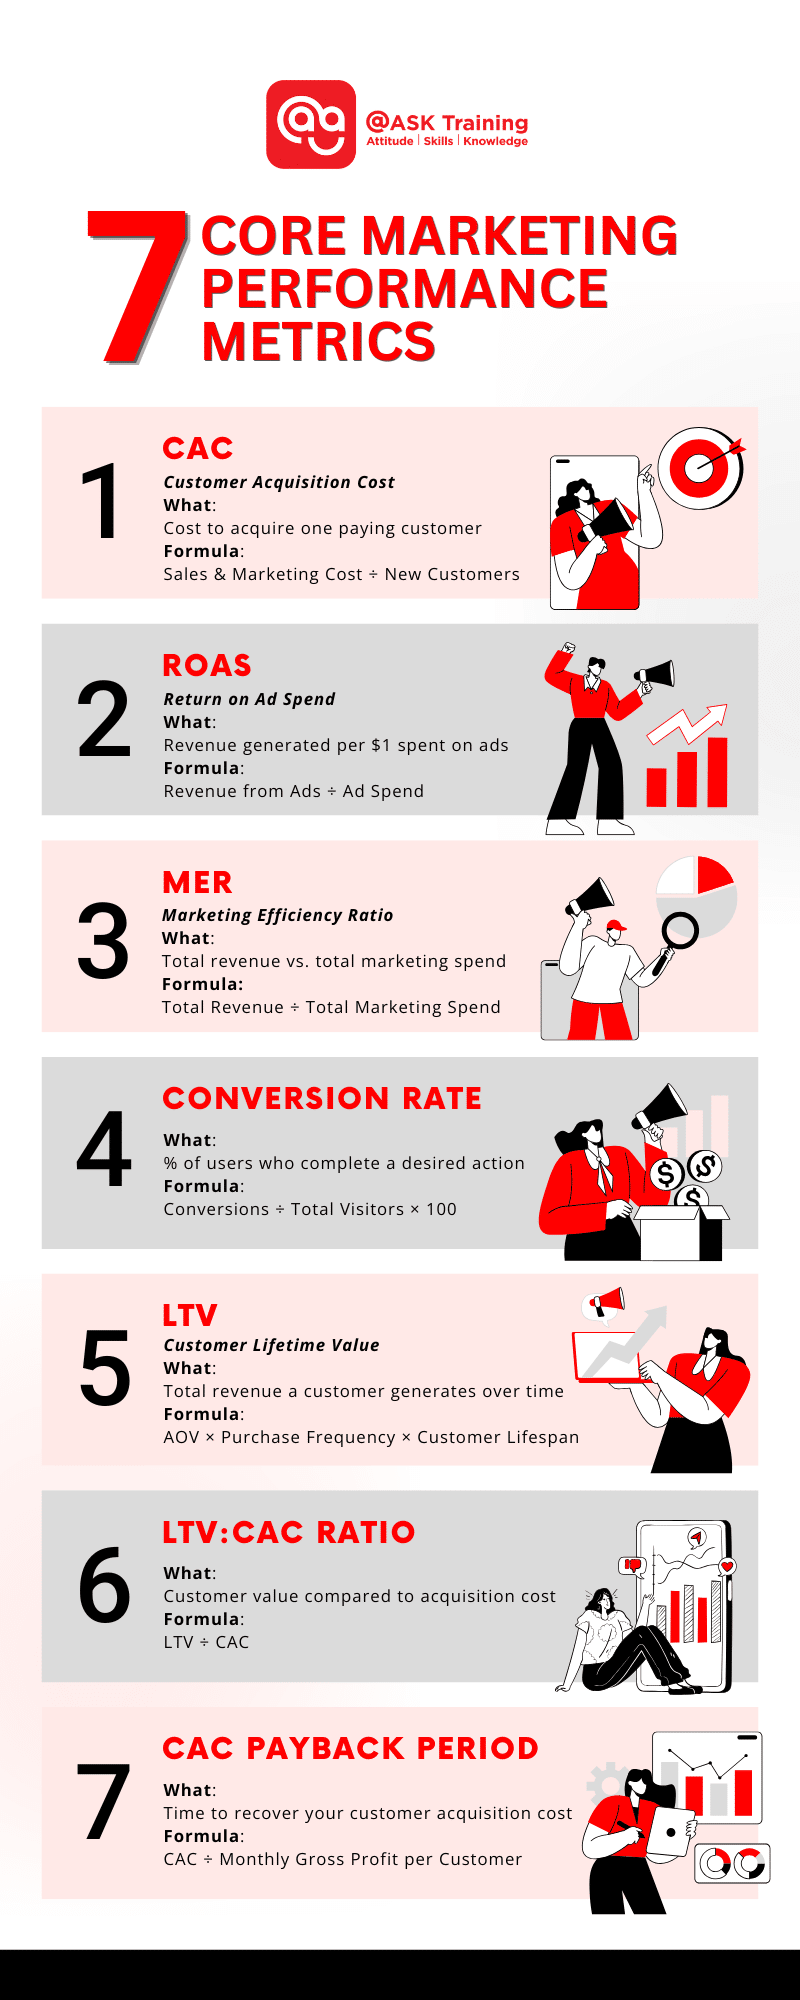
Here are the core metrics worth understanding:
Customer Acquisition Cost (CAC)
Customer Acquisition Cost tells you how much it costs to acquire one paying customer.
Formula: CAC = Total sales and marketing cost / Number of new customers acquired
This is more useful than cost per click or cost per lead because it focuses on actual customers.
Example:
A Singapore course provider may generate leads at $8 each. That looks good. But if only 1 in 40 leads enrols, the acquisition cost is $320 per student before considering sales team time, admin work, and payment issues.
That changes the conversation completely.
Return on Ad Spend (ROAS)
Return on Ad Spend tells you how much revenue your ads generated for every dollar spent.
Formula: ROAS = Revenue from ads / Ad spend
If you spend $1,000 and generate $5,000 in tracked revenue, your ROAS is 5x.
ROAS is useful for e-commerce and direct response campaigns, but it has limits. It does not automatically account for gross margin, fulfilment cost, discounting, refunds, repeat purchase, or offline sales.
Important: A 5x ROAS may be excellent for a high-margin digital product. It may be weak for a low-margin retail product with heavy delivery costs. The lesson is to always read ROAS in the context of your actual profit margins, not as an absolute performance indicator.
Marketing Efficiency Ratio (MER)
Marketing Efficiency Ratio compares total revenue against total marketing spend.
Formula: MER = Total revenue / Total marketing spend
MER is useful because it looks at the business as a whole, not only what each ad platform claims.
This matters because platforms often over-claim or under-claim performance depending on attribution settings, cookie limitations, view-through conversions, and customer journey complexity.
Example:
A local ecommerce brand may see Meta ROAS drop, but total store revenue remains stable while branded search and direct traffic increase. MER helps the team avoid panicking over one platform’s attribution report.
Conversion Rate
Conversion rate measures the percentage of users who take a desired action.
That action could be:
- Submitting a lead form
- Buying a product
- Booking a consultation
- Signing up for a trial
- Adding a product to a cart
- Downloading a brochure
Conversion rate is one of the most powerful metrics because it affects every traffic source.
If your landing page conversion rate improves from 2% to 4%, the same media budget can produce twice as many leads or sales.
Key Takeaway: This is why performance marketing is not only about media buying. It is also about landing pages, messaging, offers, trust signals, loading speed, product presentation, and follow-up.
Customer Lifetime Value (LTV)
Customer Lifetime Value estimates how much revenue a customer generates over time.
Formula: LTV = Average order value × Purchase frequency per year × Average customer lifespan in years
Be clear about which version you are using. Revenue-LTV counts total revenue from a customer.
Margin-LTV multiplies that figure by gross margin, and is the more honest number because it reflects what the business actually keeps. Many dashboards quietly use revenue-LTV, which flatters the numbers.
This is important because not all customers are equally valuable.
A first-time buyer who only purchases once during a discount campaign is different from a repeat buyer who returns every month.
- For e-commerce, LTV may come from repeat purchases.
- For SaaS, it may come from subscription duration.
- For education, it may come from repeat course enrolments, referrals, or corporate training opportunities.
- For service businesses, it may come from repeat projects or long-term retainers.
LTV:CAC Ratio
The LTV:CAC ratio compares customer value against acquisition cost.
Formula: LTV:CAC = Customer lifetime value / Customer acquisition cost
If your LTV is $900 and your CAC is $300, your LTV:CAC ratio is 3:1.
That means every dollar spent acquiring a customer produces three dollars in customer value.
Check whether the LTV in your ratio is revenue-based or margin-based. A 3:1 ratio on revenue-LTV can still be unprofitable for a business running 30% gross margins.
The same 3:1 ratio on margin-LTV is genuinely healthy.
Caution: This is a useful benchmark, but it should not be treated blindly. A business with strong cash flow, high margins, and fast payback can tolerate different ratios from a business with slow collections and high fulfilment costs.
CAC Payback Period
CAC payback period tells you how long it takes to recover your customer acquisition cost.
This is especially important for SaaS, subscriptions, memberships, and high-ticket services.
Example:
If a SaaS company spends $600 to acquire a customer who pays $100 per month, the CAC payback period is roughly 6 months before gross margin.
This matters because a company can have good LTV but still struggle with cash flow if it takes too long to recover acquisition costs.
Acquisition and Cost Efficiency Metrics
Acquisition metrics help you understand how efficiently your marketing turns spend into customers.
Beginners often over-focus on cheap clicks and cheap leads. That is a mistake.
Cheap traffic is not useful if it does not convert. Cheap leads are not useful if the sales team cannot close them. Cheap customers are not useful if they churn, refund, or never buy again.
A better question is: are we acquiring the right customers at a cost the business can sustain?
Let us say a Singapore interior design firm runs two campaigns. Campaign A generates leads at $25 each. Campaign B generates leads at $80 each.
A beginner may prefer Campaign A. But after sales follow-up, the numbers may look like this:
| Metric | Campaign A | Campaign B |
| Cost per lead | $25 | $80 |
| Leads | 100 | 40 |
| Qualified leads | 10 | 20 |
| Closed customers | 1 | 5 |
| Average project value | $20,000 | $25,000 |
| Total Ad spend | $2,500 | $3,200 |
| CAC (spend/customers) | $2,500 | $640 |
- Campaign B looks more expensive at the lead level, but it is far better at the business level.
- Campaign A costs $2,500 to win one $20,000 project.
- Campaign B costs $640 per customer and wins five projects worth $125,000.
This is why CAC should often sit above CPL in performance reporting. CPL tells you how cheaply you acquired leads. CAC tells you how efficiently you acquired customers.
Conversion and Funnel Performance Metrics
Conversion metrics help you find where performance is breaking down. This is where many marketers should spend more time.
A campaign can fail at many points:
- The ad does not attract attention.
- The click does not reach the landing page properly.
- The landing page does not persuade.
- The form asks for too much information.
- The offer is unclear.
- The sales team follows up too slowly.
- The leads are low quality.
- The price does not match the audience.
- The product is not competitive.
If you only look at ad-level metrics, you may miss the real issue.
Example:
A local training provider may run ads for a SkillsFuture-eligible course. The ads may have a good CTR. The cost per lead may be acceptable. But enrolments remain low.
The issue may not be the ad. It may be that the landing page does not clearly explain course dates, eligibility, funding, trainer credibility, job relevance, or assessment requirements.
Expert Advice:
- For SkillsFuture-funded courses, there is another layer. CAC should be judged against net fee revenue after subsidies, not the headline course fee.
- And enquiry-to-enrolment lag is often driven by funding-window timing — SkillsFuture Credit balances, claim periods, and employer approval cycles — rather than by marketing quality.
- A campaign that looks slow in the ad account may simply be waiting on a funding cycle.
In this case, increasing media spend will not fix the problem. The funnel needs to be fixed.
A practical funnel report should include:
| Funnel Stage | Metric To Watch | What It Tells You |
| Ad exposure | Reach, impressions, frequency | Are enough people seeing the message? |
| Ad engagement | CTR, CPC | Is the message attracting interest? |
| Landing page | Landing page conversion rate, speed-to-lead | Is the page converting traffic? |
| Lead quality | Qualified lead rate | Are we attracting the right people? |
| Sales | Lead-to-customer rate | Are leads turning into revenue? |
| Revenue | CAC, revenue, ROAS | Is the campaign commercially viable? |
The most useful metric here is often not one metric. It is the movement between stages.
- If many people click but few convert, your landing page or offer may be weak.
- If many leads come in but few qualify, your targeting or form may be too broad.
- If qualified leads are strong but sales are weak, the issue may be price, sales follow-up, timing, or trust.
In Singapore lead generation, response speed is often the single biggest lever at the sales stage. A lead answered on WhatsApp within minutes converts very differently from one that receives an email two days later. Track speed-to-lead alongside your funnel metrics.
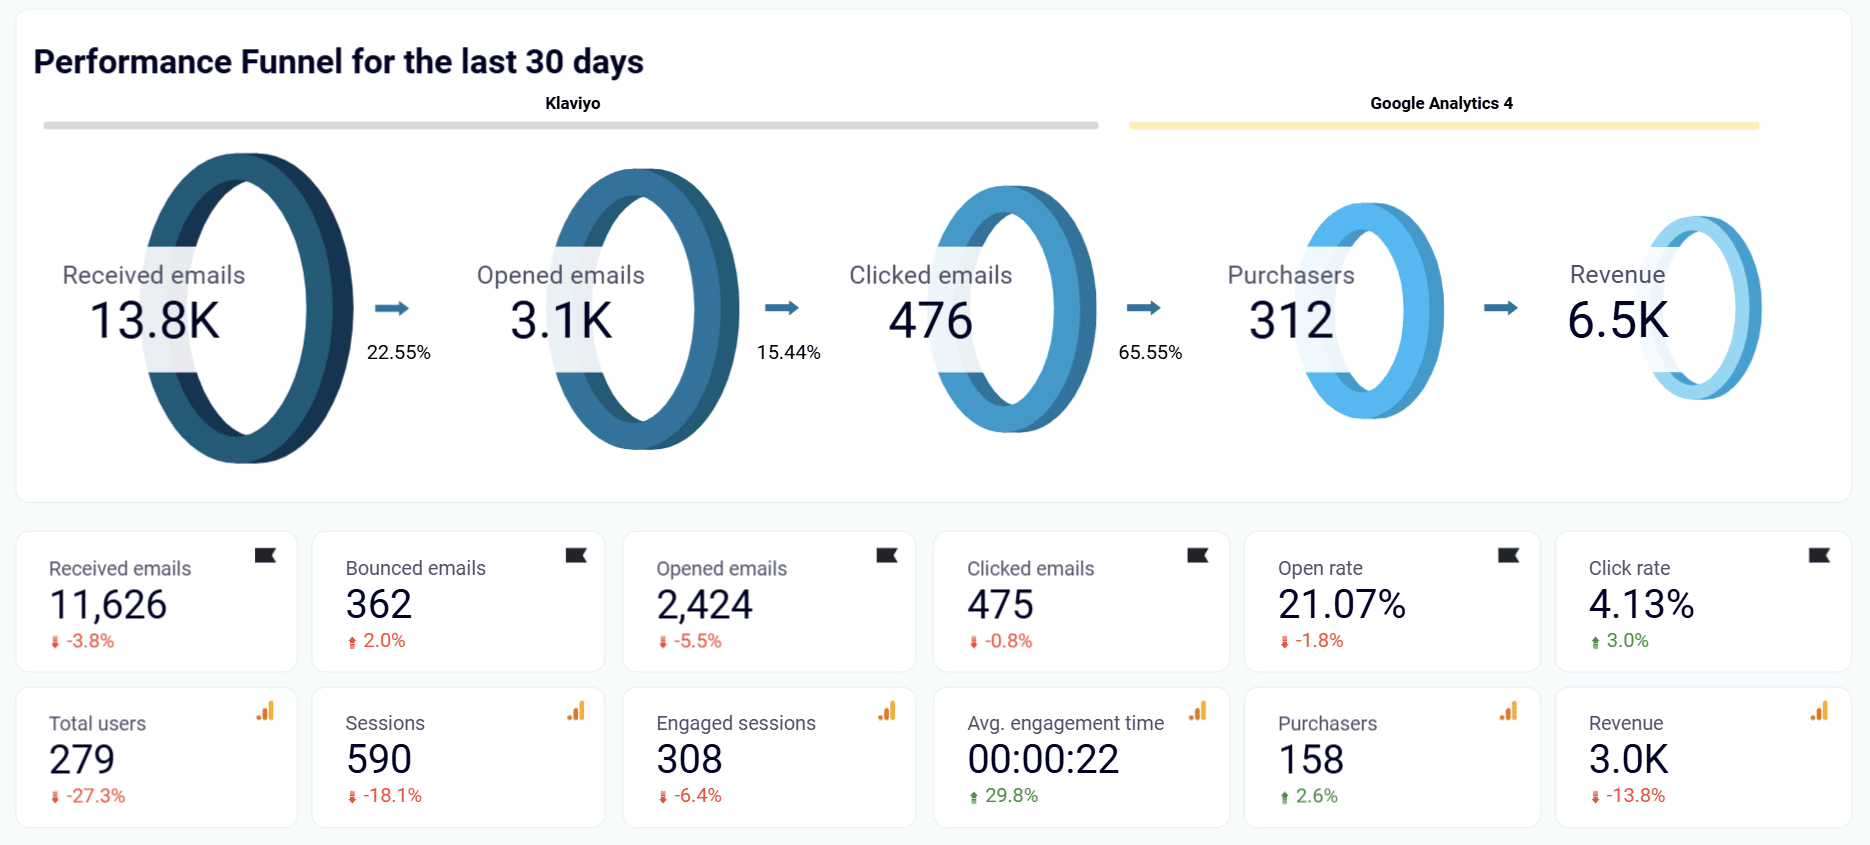
Example of Marketing Funnel Dashboard (Source: Coupler.io)
This is where sales and marketing alignment becomes critical; marketing cannot fix a broken sales process, and sales cannot compensate for poor lead quality.
Revenue Quality and Long-Term Growth Metrics
Revenue alone is not enough.
Some revenue is healthy. Some revenue is expensive. Some revenue creates future growth. Some revenue creates operational pain.
A beginner may celebrate a campaign that drives many first-time purchases.
A more experienced marketer asks:
- Were these customers profitable?
- Did they only buy because of a heavy discount?
- Did they come back?
- Did they refund?
- Did they refer others?
- Did they buy higher-margin products later?
This matters for e-commerce brands in Singapore because the market is compact and competition is intense. If a brand keeps reacquiring one-time discount buyers, it may look like it is growing while quietly weakening profitability.
For Saas And Subscription Businesses, Retention Is Even More Important
A campaign that brings in many customers with high churn is not a growth engine. It is a leaky bucket.
This is where marketing metrics that matter go beyond acquisition. You need to track:
- Repeat purchase rate
- Retention rate
- Churn rate
- Average order value
- Gross margin
- Refund rate
- Customer lifetime value
- LTV:CAC ratio
- CAC payback period
A Practical Example
An online supplement store spends heavily on ads and acquires many first-time buyers through a 40% discount.
The first purchase ROAS looks good. But if customers do not return at full price, the campaign may not create long-term value.
In that situation, the marketing team should not only optimise ads. It should look at product bundling, replenishment reminders, post-purchase email, subscriptions, loyalty offers, and customer education.
Key Takeaway: Revenue quality is where performance marketing meets customer strategy – and where many marketing teams fall short because retention is rarely owned by a single department.
Attribution, Blended Measurement, and Marketing Efficiency
Attribution is useful, but it is not reality. It is a model.
This is one of the most important mindset shifts in modern performance marketing. Attribution tries to answer: which channel deserves credit for the conversion?
The problem is that customers do not behave in clean, trackable lines.
A customer may see your TikTok video, click a Meta ad, search your brand on Google, read reviews, visit your website directly, ask a friend, and convert 5 days later.
Which channel caused the sale? The honest answer is that several touchpoints may have contributed.
That is why platform-level reporting can be dangerous if read in isolation. Meta may claim credit. Google may claim credit. GA4 may show something else. Shopify, HubSpot, your CRM, and your finance report may all show slightly different numbers.
Caution: This does not mean you should ignore attribution. It means you should use it carefully.
Google Analytics 4’s data-driven attribution model assigns fractional credit based on how touchpoints contribute to key event probability, which is more nuanced than giving all credit to the last click.
But even data-driven attribution has limitations. It still depends on available data, consent, tracking configuration, platform coverage, and event quality.
This is why marketers should combine attribution with blended measurement.
Useful blended metrics include total revenue, total marketing spend, MER, blended CAC, overall conversion rate, new customer revenue, returning customer revenue, gross margin, and contribution profit.
This is where marketing ROI metrics become more meaningful.
Instead of asking only, which platform claims the best ROAS, ask: when total marketing spend goes up, does total profitable revenue go up as well?
That question is harder to answer, but it is more commercially honest.
What To Look At Alone, and What To Look At Together
Some metrics are useful on their own. Most are more useful in combination.
Here is a practical guide:
| Metric | Can You Read It Alone? | Better Paired With | Why |
| Impressions | Rarely | Reach, frequency, CTR | Impressions alone only show delivery |
| CTR | Sometimes | Conversion rate, CPC, lead quality | High CTR may still attract poor traffic |
| CPC | Rarely | Conversion rate, CAC | Cheap clicks may not become customers |
| CPL | Rarely | Qualified lead rate, close rate, CAC | Cheap leads can waste sales time |
| ROAS | Sometimes | Margin, LTV, MER | Revenue is not the same as profit |
| CAC | Yes, but carefully | LTV, payback period, gross margin | Acquisition cost must be judged against value |
| LTV | No | CAC, retention, churn | High LTV is only useful if acquisition is sustainable |
| MER | Yes | Channel ROAS, spend mix, margin | Strong blended efficiency still needs channel diagnosis |
The beginner mistake is to optimise one metric without checking the trade-off.
- Reducing CPL may reduce lead quality.
- Increasing ROAS may reduce scale.
- Increasing conversion rate may attract lower-value customers if the offer is too aggressive.
- Increasing traffic may reduce average user quality.
- Increasing discounts may raise revenue while damaging margin.
Good measurement is not about chasing one number. It is about understanding the relationship between numbers.
Choosing the Right Metrics for Your Business Stage
The right metrics depend on where the business is.
A new business should not measure itself the same way as a mature brand. A B2B SaaS company should not use the same dashboard as a fashion ecommerce store. A local service business should not blindly copy a venture-funded startup’s growth dashboard.
The right metrics depend on where the business is, what it sells, and how customers buy.
Early-Stage Business
At this stage, the goal is usually to find what works.
Priority metrics include:
- Conversion rate
- CAC
- Cost per qualified lead
- First purchase ROAS
- Enquiry-to-sale rate
- Customer feedback quality
Do not overcomplicate the dashboard. The business needs to know which audience, offer, channel, and message can produce real customers.
For a new Singapore home-based bakery, tracking impressions and likes may be useful for awareness. But the real question is whether social content and ads produce orders, repeat purchases, and referrals.
Growth-Stage Business
At this stage, the goal is to scale without breaking economics.
Priority metrics include:
CAC, ROAS, MER, LTV, repeat purchase rate, gross margin, and payback period.
Warning: This is where many businesses get into trouble. They scale spend because top-line revenue rises, but they do not notice rising acquisition cost, lower quality customers, weaker retention, or shrinking margins.
For a growing ecommerce brand, the dashboard should separate new customer revenue from returning customer revenue. Otherwise, repeat buyers may hide weak acquisition performance.
Mature Business
At this stage, the goal is efficiency, profitability, and channel balance.
Priority metrics include:
MER, incrementality, contribution margin, customer cohort value, retention, market share indicators, brand search demand, and channel mix efficiency.
Key Insight: A mature brand should not blindly cut every channel with weak last-click ROAS. Some channels create demand. Others capture demand.
For example, paid social, YouTube, influencers, PR, and content may support discovery. Search, marketplaces, direct traffic, email, and retargeting may capture existing demand.
If you only fund the bottom of the funnel, you may enjoy efficient short-term sales while slowly weakening future demand.
B2B or High-Ticket Services
For B2B, professional services, education, renovation, finance, or enterprise SaaS, the sales cycle is usually longer.
Priority metrics include qualified lead rate, sales accepted lead rate, pipeline value, lead-to-opportunity rate, opportunity-to-close rate, CAC, sales cycle length, and revenue by source.
For these businesses, raw lead volume is often a trap.
A campaign with fewer leads but stronger qualification may be far better than a campaign that floods the sales team with weak enquiries.
Common Fallacies and Mistakes Beginners Make
Beginners usually do not fail because they lack data. They fail because they misread the data.
Mistake 1: Treating Platform ROAS as Absolute Truth
Ad platforms report performance from their own view of the world. That does not mean they are lying. It means each platform has its own attribution logic, tracking limitations, conversion windows, and modelling assumptions.
How to avoid this:
- Always compare platform data with GA4, CRM data, ecommerce backend data, and actual revenue.
- Use blended metrics like MER to get a more complete picture
- Don't make budget decisions based on a single platform's report
Mistake 2: Optimising for Cheap Leads
Cheap leads often look good in reports. But if the leads are unqualified, they create hidden costs:
- Sales teams waste time.
- Follow-up rates drop.
- Conversion rates fall.
- Team morale suffers from chasing dead ends
How to avoid this:
- Optimise for lead quality, not lead volume
- Track qualified lead rate and close rate alongside CPL
Remember: Sometimes the real problem is simple: the campaign was optimised for form fills, not customers.
Mistake 3: Looking at ROAS Without Margin
ROAS is revenue-based. It does not automatically tell you profit.
Why this matters:
- A product with low gross margin may have strong ROAS but weak profit
- High fulfilment costs can eat into revenue
- Refund rates and heavy discounting reduce actual profitability
How to avoid this:
- Track gross margin alongside ROAS
- Calculate contribution profit, not just revenue
- Understand your true cost of goods sold (COGS)
Mistake 4: Judging Long-Sales-Cycle Campaigns Too Early
If the buying journey takes 60 days, a 7-day report will not tell the full story.
The danger:
- You may pause campaigns that would have produced good customers later
- Early data can make a campaign look expensive before conversions close
- You optimise too aggressively based on incomplete information
How to avoid this:
- Use leading indicators early
- Wait for lagging indicators before making bigger budget decisions
- This is where CRM discipline matters – track leads through the entire sales cycle
Mistake 5: Ignoring Retention
Acquisition gets attention because it is visible. Retention often gets ignored because it sits across multiple departments:
- Product
- Service
- Email marketing
- CRM
- Loyalty programmes
- Customer experience
Why this is costly:
- If customers return, your acquisition cost becomes easier to justify
- High churn means you're constantly filling a leaky bucket
- Repeat customers are typically more profitable than new ones
How to avoid this:
- Track repeat purchase rate, retention rate, and churn rate
- Invest in post-purchase communication and loyalty programmes
- Align marketing, sales, and customer success teams around retention goals
Mistake 6: Reporting Too Many Metrics to Leadership
Leadership usually does not need 30 metrics. They need a clear, concise view of what matters.
What leadership actually needs:
- Spend (total marketing investment)
- Revenue generated
- CAC (cost to acquire customers)
- ROAS or MER (efficiency metrics)
- Conversion rate
- Lead or customer quality indicators
- Margin impact
Every report should also state what changed since the last report and what action is recommended.
These are report sections, not extra metrics, and they are what turns a dashboard into a decision.
How to avoid this:
- Simplify your dashboard to 5–7 key metrics
- Focus on metrics that drive decisions, not just data that looks interesting
- A good report should lead to a decision
The Bottom Line: The best marketers don't avoid mistakes because they have more data. They avoid mistakes because they know which metrics to trust, which to question, and how to read them in combination, not isolation.
The Future of Marketing Performance Measurement
Marketing measurement is becoming harder and more advanced at the same time.
It is harder because customer journeys are fragmented, privacy expectations are higher, and platform-reported data does not always show the full picture.
It is more advanced because marketers now have better tools for modelling, forecasting, automation, and first-party data analysis.
There are four major shifts worth paying attention to.
1. First-Party Data Will Matter More
Businesses can no longer rely only on platform pixels and third-party tracking.
They need cleaner first-party data from website events, CRM systems, ecommerce platforms, email platforms, offline sales teams, customer databases, call tracking, payment systems, and revenue systems.
Google’s enhanced conversions are designed to improve conversion measurement by using observable first-party data collected through the Google tag, while supporting more privacy-conscious measurement.
In Singapore, this must be built on PDPA-compliant consent.
If you plan to use customer lists for CRM remarketing, lookalike audiences, or enhanced conversions, make sure your data collection notices and consent actually cover those uses.
Clean first-party data that was collected without proper consent is a liability, not an asset.
For Singapore businesses, the practical point is simple. Your ad account cannot do all the work if your website, CRM, and sales data are messy.
2. Attribution Will Be Supported by Incrementality Testing
Attribution tells you what gets credit.
Incrementality asks a better question: what happened because of the marketing activity that would not have happened otherwise?
Google has been making incrementality testing more accessible through lower spend thresholds and improved methodology across campaign types, according to its Ads and Commerce product updates.
This is important because a campaign may appear to drive conversions that would have happened anyway.
For example, branded search often looks highly efficient. But some users searching for your brand may already have decided to buy.
Incrementality testing helps separate captured demand from created demand.
3. Marketing Mix Modelling Will Become More Practical
Marketing Mix Modelling, or MMM, used to feel like something only large companies could afford.
That is changing.
Google released Meridian as an open-source Marketing Mix Model built for modern consumer journeys and cross-channel measurement. Google’s developer documentation describes Meridian as an open-source MMM designed to support privacy-durable advanced measurement.
This does not mean every SME needs to run MMM tomorrow. But the direction is clear.
Measurement is moving beyond platform screenshots and towards more blended, modelled, and business-level analysis.
4. AI Will Help Analyse Performance, but It Will Not Fix Bad Thinking
AI can help marketers summarise reports, detect anomalies, forecast outcomes, generate insights, and speed up analysis.
Google’s Think with Google has discussed how AI-powered measurement can improve data management, insights, decisions, and results for marketers.
But AI does not automatically know which metric matters most to your business.
If your tracking is messy, AI will analyse messy data. If your goals are vague, AI will optimise towards vague outcomes. If your team rewards cheap leads, AI will help you get more cheap leads.
The future of measurement is not just AI. It is better data discipline, better business questions, and better judgment.
Singapore Context
This is also relevant in Singapore because digital adoption is no longer limited to technology companies. IMDA’s Singapore Digital Economy Report 2025 states that more than two-thirds of Singapore’s digital economy came from digitalisation in non-Information & Communications sectors.
That means better marketing measurement is increasingly relevant to mainstream sectors, including retail, education, healthcare, finance, logistics, F&B, and professional services.
A Practical Metric Guide by Business Type
Here is a simpler way to decide what to focus on.
| Business Type | Primary Metrics | Secondary Metrics | Watch Out For |
| New e-commerce brand | Conversion rate, CAC, ROAS | AOV, add-to-cart rate, checkout rate | Mistaking discount-driven sales for real demand |
| Mature ecommerce brand | MER, LTV, repeat purchase rate | ROAS, margin, refund rate | Scaling revenue while shrinking profit |
| Local service business | Cost per qualified lead, close rate, CAC | CPL, enquiry volume, response time | Optimising for cheap enquiries |
| B2B lead generation | Pipeline value, qualified lead rate, CAC | CPL, CTR, landing page conversion rate | Counting leads before checking sales quality |
| SaaS or subscription | CAC, LTV, churn, CAC payback | Trial-to-paid rate, retention, activation | Acquiring customers who leave too quickly |
| Education or training | Enrolment rate, CAC against nett fees, qualified lead rate | CPL, course page conversion rate | Treating enquiries as enrolments; ignoring funding-cycle lag |
| Retail or omnichannel | MER, store sales lift, online revenue, repeat purchase | ROAS, footfall, email revenue | Under-counting offline influence |
Conclusion: Stop Reporting Everything
The best marketing dashboard is not the biggest one. It is the one that helps the business make better decisions.
Vanity metrics can show visibility. Leading metrics can diagnose problems. Lagging metrics can prove commercial impact.
But none of these metrics should live in isolation.
Here’s a quick recap:
CTR means little without conversion rate. CPL means little without lead quality. ROAS means little without margin. CAC means little without LTV. Revenue means little without profitability.
- For early-stage businesses: Focus on finding working channels, offers, audiences, and conversion points.
- For growth-stage businesses: Focus on CAC, ROAS, MER, LTV, and payback.
- For mature businesses: Focus on efficiency, incrementality, retention, margin, and channel balance.
- For B2B or high-ticket businesses: Focus less on raw lead volume and more on qualified pipeline, close rate, sales cycle length, and revenue by source.
The beginner mistake is to report what is easy to measure. The better approach is to report what helps the business act.
That is the real purpose of performance measurement. Not to prove that marketing was busy. To prove that marketing helped the business grow.
Understanding marketing performance metrics is one thing. Mastering the tools to track, analyse, and optimise them is what sets top marketers apart.
Ready to Master Performance Marketing Analytics?
At @ASK Training, our range of Digital Marketing courses equips you with practical, hands-on skills using tools like Google Analytics 4. Learn from industry veterans and earn a certification that validates your expertise.
Explore our Digital Analytics courses:
- (24hrs) Digital Marketing Analytics (Google Analytics) – Master Google Analytics 4 to measure campaigns, identify key tools, and forecast demand.
- (16hrs) Digital Advertising – Learn to craft a well-rounded digital advertising strategy from start to finish, while tracking your performance to make cost-effective decisions.
- (24hrs) Website and Landing Page Conversion Optimisation – Learn consumer psychology and design techniques to boost engagement and conversions.
Enrol with us! Start measuring what matters and build the skills to prove it.
Related Courses
◆◆◆
Related Articles
Article Topics
- Why Reports Fail
- Vanity, Leading & Lagging Metrics
- Lagging Metrics
- Core Revenue Metrics
- Acquisition & Cost Efficiency
- Conversion & Funnel Metrics
- Revenue Quality
- Attribution & Marketing Efficiency
- Business Stage Metrics
- Common Metric Mistakes
- Future of Measurement
- Metric Guide by Business Type
- Conclusion