 You’ve built complex models, mastered pivot tables, and lived in Excel for years. However, your workbook now takes forever to open.
You’re drowning in different report versions from last week’s email chain. You’ve just hit the dreaded million-row limit.
Sound familiar? You’re not alone. Many Excel-heavy professionals hit a wall where their go-to tool starts to slow them down.
This isn’t about replacing Excel. It’s about knowing when to use its power and when to harness the scale of Power BI.
Let’s break down the Power BI vs Excel debate, explore their unique strengths, and show you how to make them work together seamlessly.
When Excel Still Works Best
Excel remains the undisputed champion for specific tasks. Its flexibility and familiarity make it perfect for quick, personal analysis.
Think of Excel data analysis as your digital scratchpad. You can quickly test formulas, build ad-hoc calculations, and create flexible models with small-to-medium datasets.
Excel is your best bet for:
- One-Person Projects: When you’re the only one building and using the report.
- Deep, Offline Analysis: Needing to work independently without an internet connection.
- Initial Data Exploration: Playing with data before committing to a larger, automated dashboard.
For instance, a finance analyst calculating a one-off budget variance for a single department can do it faster and more flexibly in Excel than in any other tool.
So, when should you happily stay in Excel? When your work is personal, ad-hoc, and doesn’t involve complex sharing. But what happens when your needs grow beyond that scope?
Where Excel Starts to Struggle
As your data grows and your processes mature, you’ll likely feel Excel’s limits. The very features that make it flexible can become bottlenecks.
Common pain points include:
- Performance Issues: Large datasets (over 1M rows) or complex workbooks with thousands of formulas slow your computer to a crawl.
- Version Control Chaos: Emailing files creates multiple “final” versions, leading to confusion and errors.
- Manual Repetition: You waste hours every month manually cleaning, consolidating, and updating data from multiple sources.
- Static Reporting: Your charts are flat and non-interactive, limiting others’ ability to explore the insights.
Imagine a sales analyst manually merging 20 regional Excel files every month. It’s not just tedious; it’s a significant risk for errors.
Recognising these struggles is the first step. The next step is understanding what a tool built for these specific challenges can offer.
What Power BI Adds to the Equation
Power BI is built for scale, automation, and collaboration. It transforms your raw data into interactive, shareable stories.
Here’s what it brings to the table:
- Massive Data Handling: Connect to and analyse millions of rows from multiple sources (SQL databases, cloud services, etc.) without performance hits.
- Automated Refresh: Schedule your data to update automatically. Say goodbye to manual monthly updates.
- Interactive Dashboards: Create Power BI dashboards with drill-downs and slicers that let users explore the data themselves.
- Centralised Collaboration: Publish reports to the Power BI Service so everyone sees the same live version, eliminating file chaos.
Instead of emailing ten different spreadsheets, you publish one Power BI dashboard that updates in real-time for the entire team.
The advantages are clear, but as an Excel pro, it’s wise to understand what you’re signing up for before making the leap.
Limitations Excel Users Should Expect in Power BI
Switching to Power BI isn’t without its challenges. As an Excel user, you should be prepared for a shift in mindset.
Key considerations include:
- A Learning Curve: You’ll need to learn Power Query for data transformation and DAX for formulas, which are different from Excel’s function logic.
- Customisation Limits: While powerful, you can’t always pixel-perfect format reports exactly as you would in an Excel sheet.
- Licensing Costs: Sharing dashboards requires a Power BI Pro license (approx. $10/user/month).
- Potential IT Involvement: Setting up secure, automated data pipelines might require support from your IT department.
A common pitfall is a team adopting Power BI without clear data governance, leading to conflicting reports; a problem that technology alone can’t solve.
Knowing these hurdles upfront allows you to prepare for them. And the best news? Adopting Power BI doesn’t mean abandoning Excel; in fact, they’re stronger together.
How Excel and Power BI Work Together
The magic happens when you stop seeing it as Power BI vs. Excel and start leveraging the integration between Excel and Power BI. They are complementary tools in your analytics toolkit.
Excel vs Power BI: Comparison & How They Work Together
1. PRIMARY USE
- Excel: Spreadsheets & personal analysis
- Power BI: Dashboards & shared analytics
- How they work together: Excel for deep analysis, Power BI for visualisation
2. DATA SIZE
- Excel: Best for <1 million rows
- Power BI: Handles millions of rows easily
- How they work together: Prepare data in Excel, visualise large datasets in Power BI
3. AUTOMATION
- Excel: Manual updates required
- Power BI: Scheduled refresh available
- How they work together: Build models in Excel, automate reporting in Power BI
4. SHARING
- Excel: File-based (email attachments)
- Power BI: Centralised portal access
- How they work together: Share detailed Excel files alongside summary Power BI dashboards
5. ANALYSIS STYLE
- Excel: Flexible, ad-hoc investigation
- Power BI: Standardised, interactive exploration
- How they work together: Use the “Analyse in Excel” feature with Power BI datasets for the best of both worlds
Think of it this way:
- Use Excel for deep, calculation-heavy modelling and what-if analysis.
- Use Power BI for visualisation, automation, and secure sharing.
Integration in action:
- Clean and Model in Excel, Visualise in Power BI: Your marketing team can clean the lead list in a familiar Excel file, then load it into Power BI to build a stunning, interactive campaign performance dashboard.
- Analyse in Excel: Use the “Analyse in Excel” feature to pull a live Power BI dataset into a PivotTable for the deep, personal analysis you love.
This collaborative approach is the key to modern analytics. So, how can you, as an Excel expert, start this transition without feeling overwhelmed?
Tips for Excel Users Transitioning to Power BI
Making the jump doesn’t have to be overwhelming. A strategic approach will set you up for success.
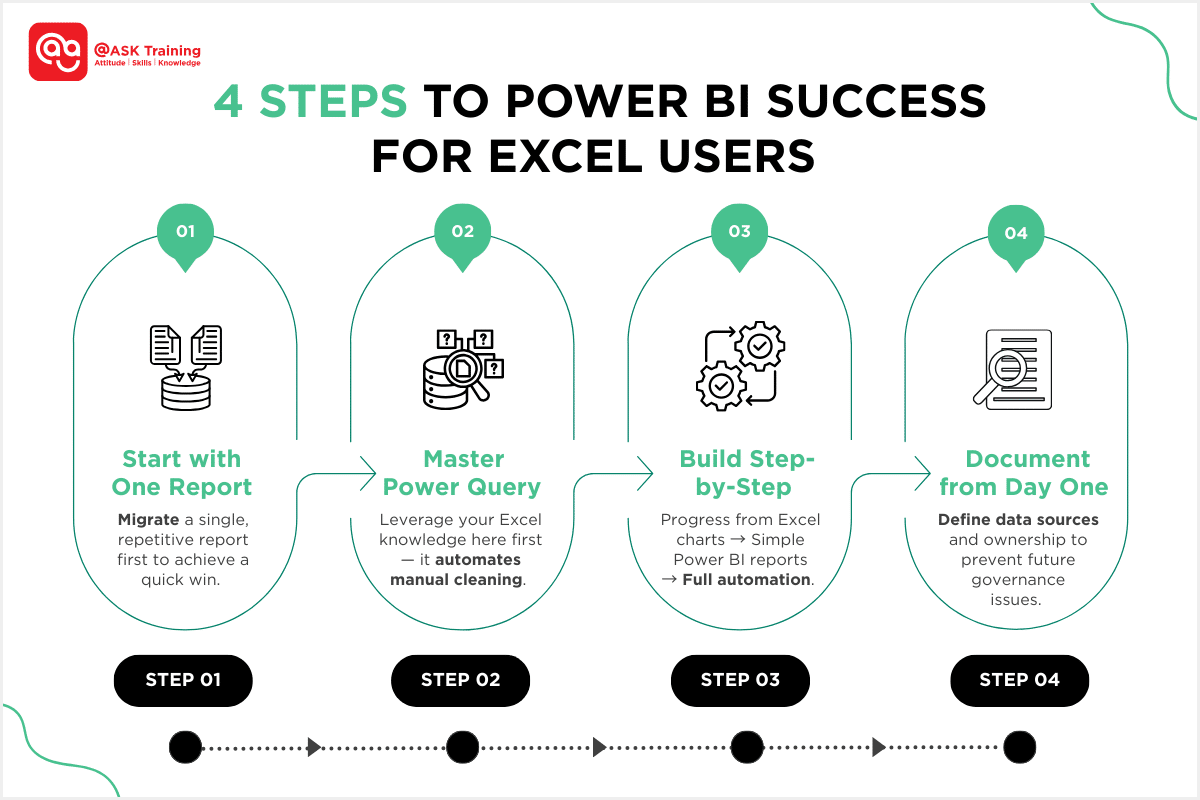
#1 Start with a Single Painful Report
Choose one repetitive, time-consuming report (like monthly sales) and migrate it first. This delivers a quick win.
#2 Learn Power Query First
If you already use Power Query in Excel, you’re halfway there. It’s the most familiar starting point and automates the data cleaning you currently do manually.
#3 Build Confidence Gradually
Move from creating Excel charts to building a simple Power BI report, then to full automation with scheduled refresh.
#4 Document Your Processes
Define where data comes from and who owns it. This prevents future governance issues as your usage scales.
Example: An Excel-heavy finance team trained on Power Query first. They then gradually rolled out dashboards, cutting their monthly reporting time by 40%.
 By taking these steps, you’re not just learning a new tool; you’re strategically upgrading your entire analytical workflow.
Wrapping Up
So, what’s the final verdict in the Power BI vs Excel debate? There isn’t one.
- Excel is your tool for fast, flexible, and personal analysis.
- Power BI is your platform for scale, automation, and collaboration.
You don’t have to choose. The best results come from using both together.
The next time your Excel workbook crashes or you spend hours on a manual update, try building that same report in Power BI.
You’ll quickly see how this powerful partnership can transform your workflow.
Ready to Master This Powerful Partnership?
Understanding the theory is the first step; applying it effectively is what gives you a real competitive edge. @ASK Training is here to help you and your team build these critical skills!
For Individuals:
Dive deeper with our specialised course, Bridging Big Data Analytics using Excel & Power BI, to learn how to seamlessly integrate these tools.
For Organisations:
Elevate your entire team’s capabilities with our tailored Corporate Training solutions. We offer customised programs to empower your workforce with practical, data-driven decision-making skills.
Transform your data into your greatest asset. Explore our courses and contact us today!