In today’s fast-paced business environment, Singaporean companies rely on data-driven decisions more than ever.
To stay competitive, professionals need to analyze and interpret vast amounts of information quickly and efficiently. This is where mastering advanced Excel formulas becomes crucial.
Why Excel Still Matters in Singapore (2024)
While there are newer data analysis tools on the market, Microsoft Excel remains a dominant force in Singapore for several reasons:
Budget 2024 Support
The Singapore government’s focus on AI development and upskilling initiatives in Budget 2024 reinforces the need for strong Excel skills across various industries. A solid foundation in Excel allows you to adapt and integrate with emerging technologies.
Widespread Use
With over 1.5 billion users worldwide, Excel reigns supreme as the king of spreadsheet software. In fact, it accounts for more than half of the estimated 2 billion spreadsheet users globally!
This dominance extends to the business world, where a whopping 54% of companies around the globe leverage Excel for tasks like data management, financial analysis, and a multitude of other functions.
This widespread adoption ensures smooth collaboration within and across companies. Many companies and organizations in Singapore, such as Shopee, Dyson, DBS Bank, and the National University of Singapore, utilize Microsoft Excel extensively for their operations and data management needs.
Business Dominance
From financial modeling and accounting to complex data analysis, Excel remains a core tool for businesses in Singapore’s dynamic economic landscape.
Mastering advanced formulas gives you a competitive edge in a data-driven world.
Digital Literacy & Cybersecurity
Budget 2024 emphasizes digital literacy and cybersecurity awareness. Excel plays a role here too!
Understanding data manipulation principles fosters responsible digital citizenship and helps ensure the security of your spreadsheets.
Excel’s Place in the Evolving Landscape
Yes, Excel has limitations. It’s primarily offline and not mobile-friendly. For highly specialized tasks, dedicated software might be the way to go.
However, here’s the beauty of Excel: it’s incredibly versatile and integrates seamlessly with other tools.
This makes it a powerful foundation for data analysis in Singapore, regardless of the specific industry.
Imagine this: complex datasets analyzed, repetitive tasks automated, and insightful reports generated – all within the familiar and user-friendly Excel interface.
While Excel offers a robust set of basic functions, unlocking its true potential lies in mastering advanced formulas.
These powerful tools transform you from a data manipulator to a data analyst, empowering you to extract valuable insights and automate complex tasks.
Here’s a look at some essential advanced Excel formulas for data analysis to become an Excel pro in Singapore (2024):
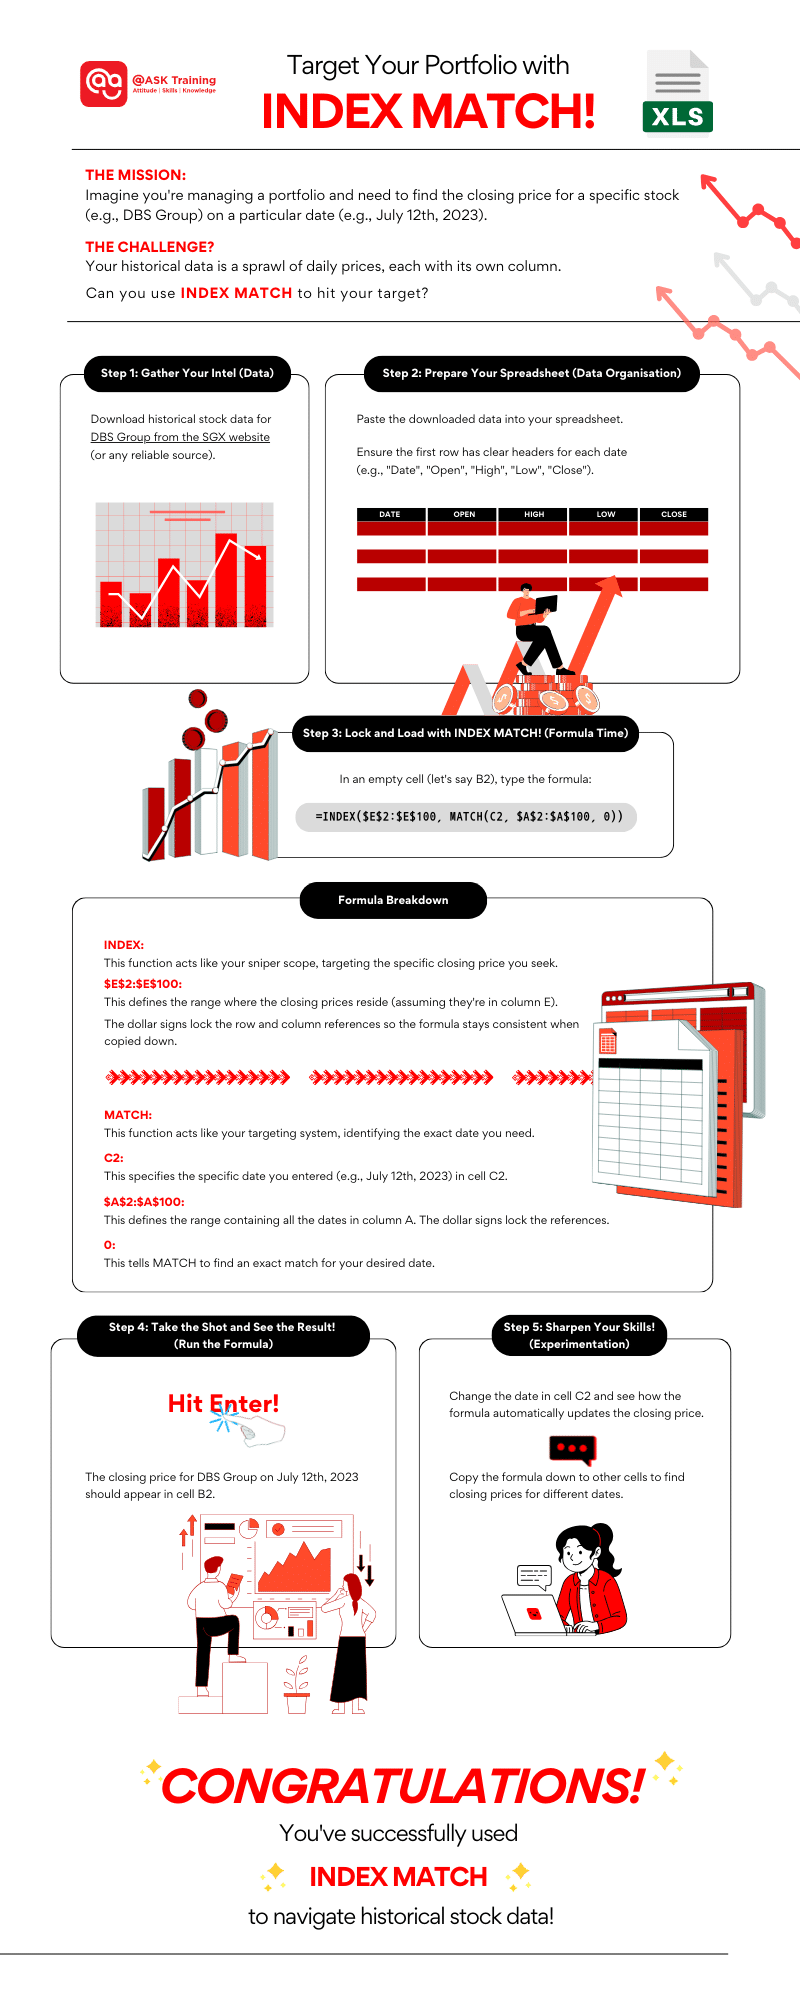
1. INDEX MATCH: The Multi-Criteria Master
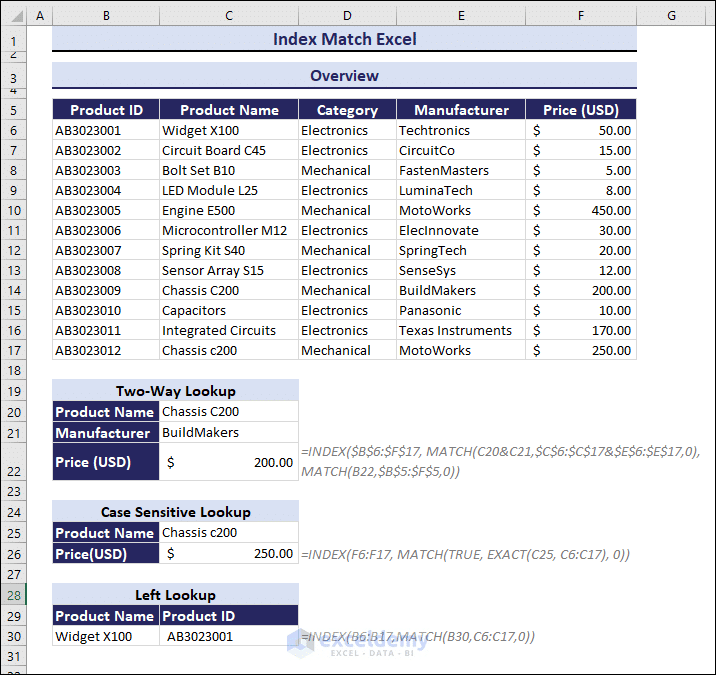
Index Match Overview Example (Source: exceldemy)
Say goodbye to the limitations of VLOOKUP and HLOOKUP! INDEX MATCH represents the dynamic duo of Excel advanced formulas that take data lookups to the next level.
How it Works:
INDEX MATCH combines the power of two functions:
- INDEX: This function retrieves a specific value from a table based on a row and column number.
- MATCH: This function finds the position of a specific value within a range of cells based on your chosen criteria (exact match, greater than, less than, etc.).
You can learn how to use this formula step-by-step here.
Here’s an activity you can try:
2. SUMIFS & COUNTIFS: Conditional Champs
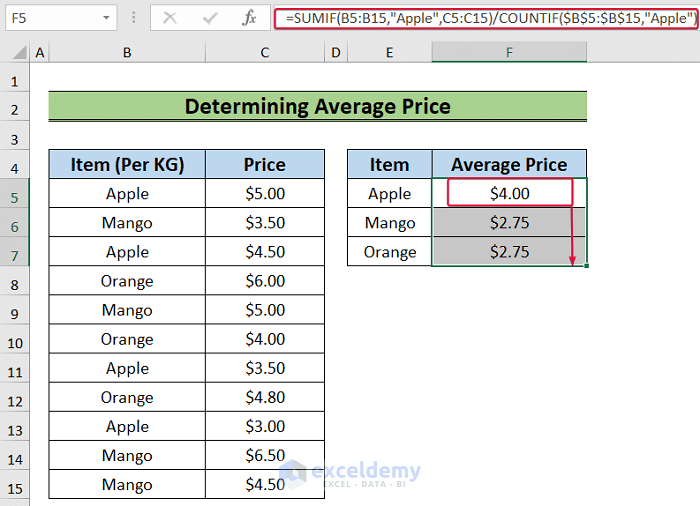
SUMIFS and COUNTIFS Example (Source: exceldemy)
Tired of cumbersome SUM and COUNT functions when dealing with specific criteria? Enter SUMIFS and COUNTIFS, the game-changers for conditional data analysis!
These Excel functions allow you to sum or count values based on multiple conditions simultaneously. Learn in more detail how you can use these functions here.
Example You Can Try: Analyze your company’s sales data by region and product category in Singapore. Use SUMIFS to calculate total sales for each category in a specific region.
Similarly, use COUNTIFS to determine the number of products sold within those criteria.
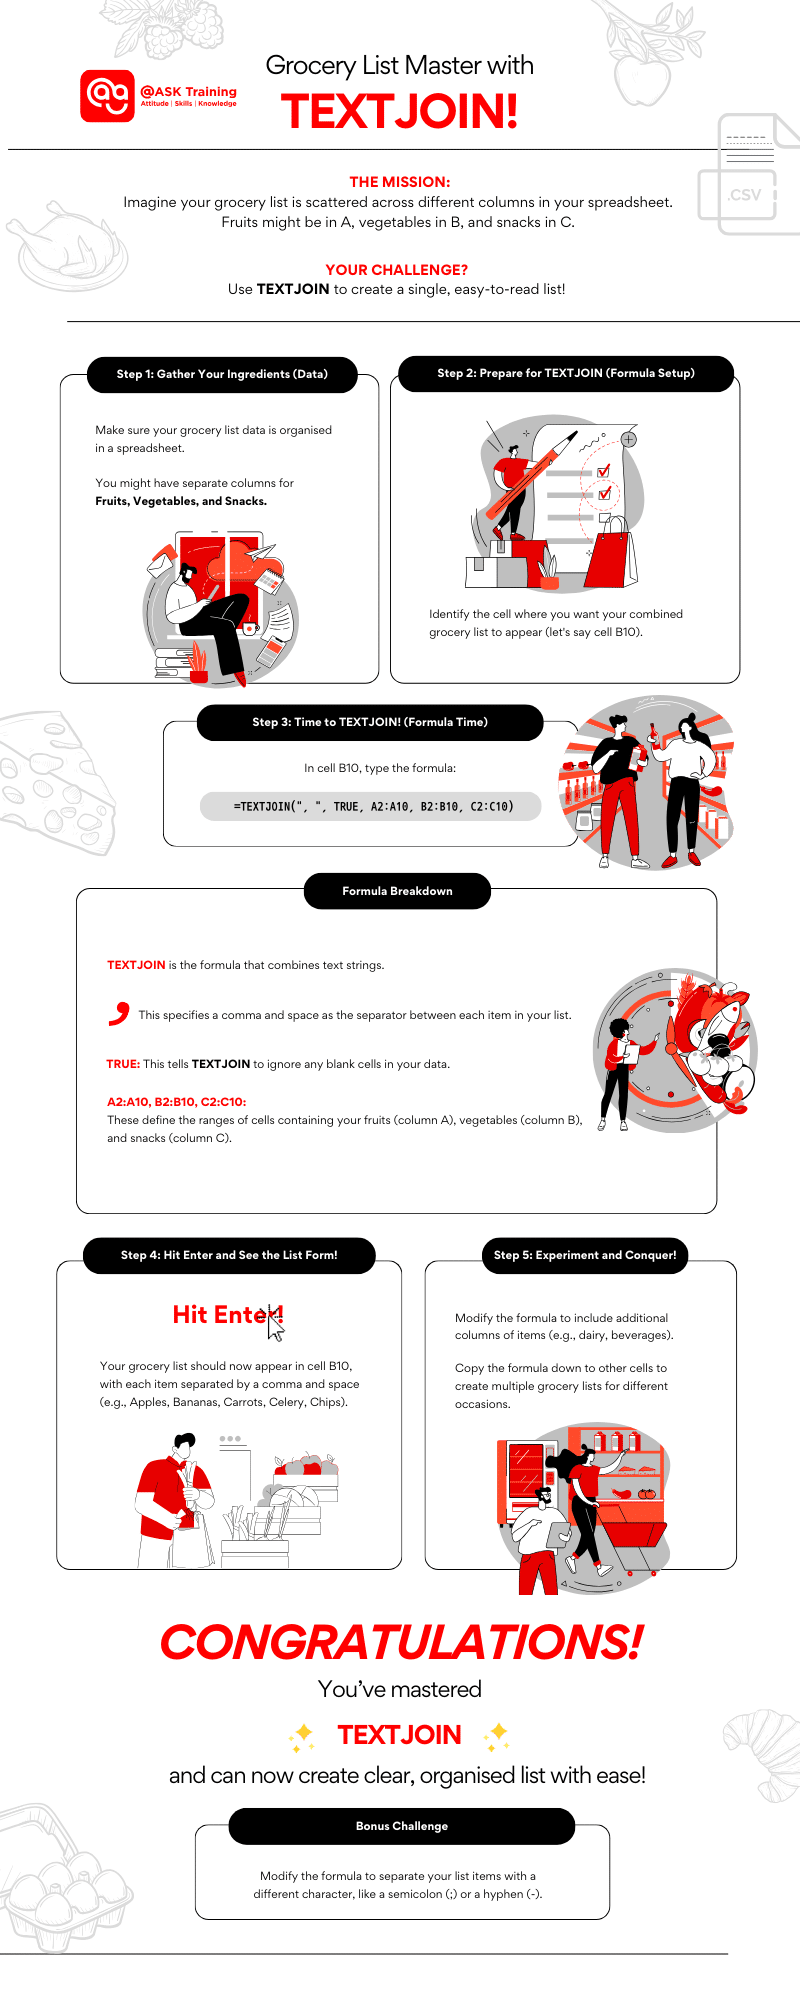
3. TEXTJOIN: The Text Tamer
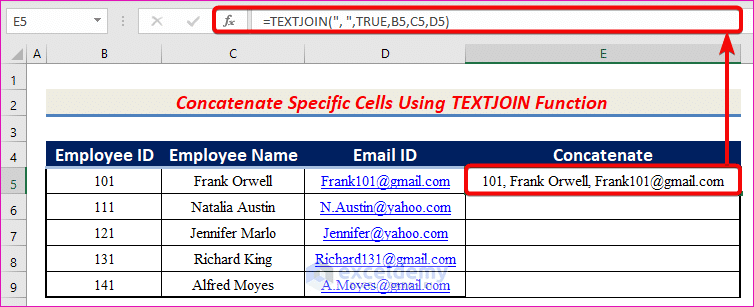
TEXTJOIN Formula Example (Source: exceldemy)
Working with text data in spreadsheets can be a nightmare. Extracting specific information or combining text from different cells often involves tedious manual manipulation.
Enter TEXTJOIN, a formula that acts like magic! It allows you to combine text from multiple cells into a single string. This is a lifesaver for tasks like:
- Generate mailing lists by combining first names, last names, and email addresses from separate columns.
- Create reports with product descriptions that automatically combine product name, color, and size information.
In simpler terms, imagine you have a bunch of scattered words (text from different cells). TEXTJOIN acts like a super glue, combining those words into a single, clear sentence (the string).
TEXTJOIN formula can benefit you to:
- Save Time & Effort: Automate the process of combining text data, eliminating manual work and potential errors.
- Improve Efficiency: Create professional-looking reports and mailing lists with ease.
Try out your own with this easy-to-follow TEXTJOIN guide.
Or
Let’s try out this fun activity!
4. LEFT, RIGHT, & MID: Data Cleaning Dream Team
Data cleaning and manipulation often involve extracting specific portions of text strings. This is where the LEFT, RIGHT, and MID functions come in handy.
These functions allow you to extract a specific number of characters from the beginning (LEFT), end (RIGHT), or middle (MID) of a text string.
For example, you might be working with a dataset of product codes in Singapore that include both the product ID and color. The LEFT function can help you extract just the product ID, while the RIGHT function could be used to isolate the color code.
Think of it like this: You have a long piece of text (the string). LEFT, RIGHT, and MID act like scissors, allowing you to cut out specific pieces (characters) of that text.
Benefits:
- Cleanse & Prepare Data: Extract specific text portions to prepare your data for analysis.
- Focus on Specific Information: Isolate the exact text data you need, making your analysis more efficient.
Find out the 5 different ways you can use MID to enhance your data-cleaning process!
Example You Can Try: Clean a list of customer addresses in Singapore. Use LEFT and RIGHT to extract postal codes from a single text string containing the entire address.
5. IFERROR & ISNA: Error Eradicators
Ever spent ages working on a complex Excel spreadsheet only to discover a frustrating #VALUE! error thrown in your face? IFERROR and ISNA are your knights in shining armor for error handling.
IFERROR: This superhero formula acts like a safety net. You tell it the formula you want to use, and then what message you’d like to display IF an error occurs.
For example, you could tell IFERROR to display “Data Missing” instead of the #VALUE! error if a cell is blank. This keeps your spreadsheet clean and easier to understand.
ISNA: This formula works similarly but specifically targets the #N/A error, which often pops up when a lookup function can’t find the information you’re searching for.
Imagine you’re looking up customer details based on their ID number. If a number doesn’t exist in your data, ISNA can display “Customer Not Found” instead of the #N/A error, making your report more informative.
By using IFERROR and ISNA, you achieve two key benefits:
- Clean and Professional Spreadsheets: No more distracting error messages cluttering your work.
- Clearer Communication: Custom messages explain what’s happening instead of cryptic error codes, making your spreadsheets easier to understand for everyone.
Learn more ways to optimize these functions and reduce your errors in this easy-to-follow guide with examples.
Here’s another fun activity you can try:

6. XLOOKUP (Excel 365 Users Only)
If you’re using Excel 365, you have access to an even more powerful lookup function – XLOOKUP. This formula offers several advantages over VLOOKUP, including:
Backward searching: You can search for a value from the end of a range instead of just the beginning.
Wildcards: You can use wildcards (*) to match a partial text string, making your searches more flexible.
ExcelDemy did an extensive explanation of all the ways you can use XLOOKUP.
7. BONUS: Pivot Table for Advanced Excel Analysis
While not strictly a formula, Pivot Tables are a cornerstone of advanced Excel data analysis. They transform raw data into clear and concise summaries, empowering you to explore trends, identify patterns, and create impactful dashboards.
Imagine you’re managing a complex dataset of sales figures. Pivot Tables allow you to:
- Effortlessly Summarise: Drag and drop fields to categorise your data by rows, columns, and values. Pivot Tables calculate totals, averages, or other statistics, providing a high-level view of your data.
- Identify Trends and Patterns: Analyse sales performance by region, product, or sales rep. Pivot Tables help you uncover hidden patterns and trends within your data, leading to valuable insights.
- Filter and Drill Down: Filter your Pivot Table based on specific criteria to focus on areas of interest. Drill down into specific details to understand the nuances of your data.
Here’s a simple example for you to try out!
Imagine you have a spreadsheet with sales data for your bakery. Each row might include details like:
- Product Name (e.g., Croissant, Cupcake, Bread)
- Quantity Sold
- Price
- Sales Rep
This data can be overwhelming to analyse at a glance. Here’s where Pivot Tables come in:
Step 1: Create a PivotTable
Select your data range and click “Insert” > “PivotTable.”
Step 2: Analyse Sales by Product
Drag “Product Name” to the “Rows” section of the Pivot Table.
This will create a row for each product, showing the total quantity sold and potentially the total sales amount (sum of price multiplied by quantity).
Step 3: Identify Top Sellers
Analyse the Pivot Table to see which products are selling the most.
This can help you identify popular items and adjust your inventory or marketing strategies accordingly.
Invest in Your Excel Expertise
Mastering these formulas and PivotTables transforms you from a data manipulator to a data analyst.
You can unlock the hidden stories within your spreadsheets, empowering you to make data-driven decisions and achieve better outcomes.
Here’s a quick recap of the essential formulas you’ll conquer:
- INDEX MATCH: Allowing you to find specific data based on multiple criteria – perfect for complex data analysis tasks.
- SUMIFS & COUNTIFS: Analyse data based on multiple criteria simultaneously. Imagine calculating sales by region and product category with ease!
- TEXTJOIN: Combines text from different cells into a single string, a lifesaver for tasks like generating mailing lists.
- LEFT, RIGHT, & MID: Extract specific portions of text strings, ideal for data cleaning and manipulation.
- IFERROR & ISNA: Define what you want Excel to display in case of errors, keeping your spreadsheets clean and professional.
- XLOOKUP (Excel 365 Users Only): Offers even more powerful lookup capabilities with features like backward searching and wildcards.
- BONUS – Pivot Table (Not A Formula): Transform complex data into clear summaries for insightful analysis and dashboards.
You’ll be working smarter, not harder, and unlocking valuable insights from your spreadsheets, giving you a competitive edge in the data-driven world of Singapore.
Want to Excel Like a Pro?
Empower yourself and your team with advanced Excel skills! This article has just scratched the surface of the power hidden within Excel formulas.
Want to take your Excel expertise to the next level? @ASK Training offers a comprehensive 2-Day WSQ Microsoft Excel Advanced course designed specifically for professionals in Singapore with up to 95% funding for eligible residents.
This WSQ-certified SkillsFuture Excel course will equip you with the knowledge and practical skills to:
- A comprehensive range of advanced Excel formulas beyond the basics covered here.
- Automate complex tasks and streamline your data analysis processes.
- Gain a competitive edge in Singapore’s data-driven landscape.
- Earn a WSQ qualification, a valuable credential recognised by employers.
Ready to take your Excel skills to the next level? Here’s a glimpse into some popular Excel courses in Singapore that can help you unlock the full potential of this powerful spreadsheet software:
- Advanced Formulas and Functions: Learn how to automate tasks, analyse complex data sets, and generate insightful reports.
- Dashboard Reporting: This course will equip you with the skills to create interactive dashboards that effectively communicate insights to stakeholders.
- Power BI: Learn how to connect to various data sources, create stunning visualisations, and share your insights seamlessly.
- VBA Programming: This course is ideal for users who want to leverage VBA scripting to truly supercharge their Excel workflows.
- Advanced Pivot Table Techniques: Learn to handle complex data sources, create insightful calculations, and format professional-looking reports.
Contact us to learn more and register today!
Related Courses
◆◆◆