 Power Query, a powerful data integration and transformation tool built into Excel, has revolutionised the way we handle and analyse data. By automating tedious data cleaning and manipulation tasks, Power Query empowers users to focus on deriving insights rather than wrestling with raw data.
In this comprehensive guide, we will embark on a step-by-step journey to master the art of data transformation using Power Query. From accessing and loading data to performing transformations, we’ll cover everything you need to know.
Accessing Power Query in Excel (Microsoft 365)
While Power Query is a powerful tool, it’s important to note that its interface can vary slightly depending on the specific version of Excel you’re using. However, the core functionalities and overall workflow remain consistent. Regardless of the version, the basic steps for using Power Query remain the same. For more information on the differences, you learn more here. For this guide, we’ll be using Microsoft 365 Excel. To get started with Power Query, you’ll first need to access it within Excel. Here’s a quick guide:
- Open your Excel workbook.
- Navigate to the “Data” tab on the Excel ribbon.
- Click on the “Get & Transform Data” button. This will open the Power Query Editor, your workspace for data transformation.
Loading Data into Power Query
Once you’re in the Power Query Editor, you can connect to a variety of data sources. Here’s a breakdown of the most common sources:
File-Based Data (Your Computer’s Files):

- Click “Get Data” and select “From File.”
- Choose the file type and navigate to the file location.
- Select the desired table or range and click “Edit” to load it into the Power Query Editor.
Database Connections:
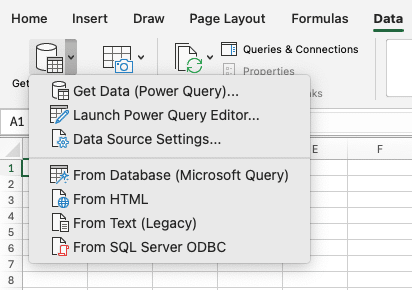
- Click “Get Data” and select “From Database.”
- Choose the database type and provide the necessary connection details.
- Select the desired table or query and click “Edit” to load it into the Power Query Editor.
Online Services:
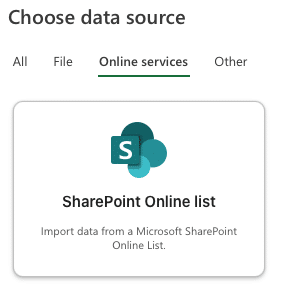
SharePoint via Excel
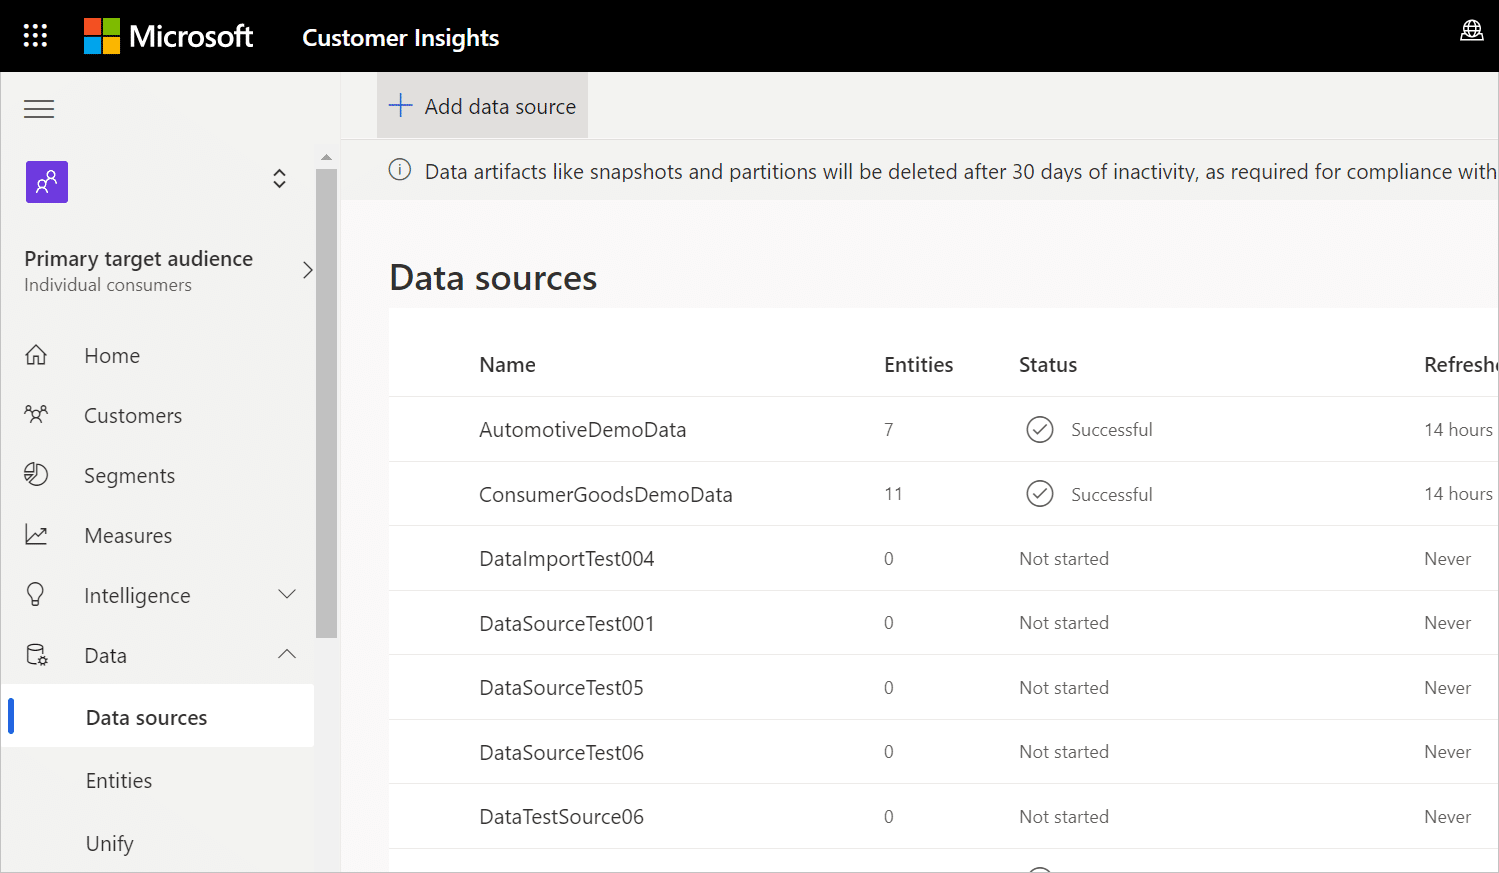
Microsoft Dynamics 365 Customer Insights
To import data from online services like SharePoint, Salesforce, or Microsoft Dynamics 365:
- Click “Get Data” and select the appropriate connector (e.g., “From SharePoint Online”, “From Salesforce”). Check which connector is compatible with your device here.
- Authenticate to the service and select the desired data source.
- Click “Edit” to load the data into the Power Query Editor.
Other Data Sources:
OData via Excel
To import data from other sources like the web, OData feeds, ODBC, or OLE DB:
- Click “Get Data” and select the appropriate connector.
- Provide the necessary information (e.g., URL, OData feed address, ODBC/OLE DB connection string).
- Click “Edit” to load the data into the Power Query Editor.
Navigating the Navigator
Once you’ve connected to a data source, the Navigator window will appear. It displays a hierarchical view of the available tables and queries within the data source.
- Select the desired table or query.
- Click “Edit” to load it into the Power Query Editor for transformation.
- Click “Load” to directly import the data into your Excel worksheet.
With your data successfully loaded into Power Query, you’re ready to unleash the power of data transformation. Let’s move on to the next section where we explore Power Query’s interface.
Navigating the Power Query Interface
To effectively use Power Query, it’s crucial to understand its user interface. Let’s break down the main components:
1. Ribbon:
Home Tab
Basic data cleaning and preparation actions like removing rows, columns, duplicates, and sorting.
Transform Tab
Advanced data transformation capabilities such as pivoting, unpivoting, merging, appending, and grouping.
Add Column Tab
Creating custom columns and applying calculations based on existing data.
View Tab
Managing the layout and visibility of different panes, as well as setting query properties.
2. Formula Bar:
- Displays the M code generated for each transformation step. While you don’t need to write M code directly, understanding it can be helpful for advanced customisations.
3. Query Pane: 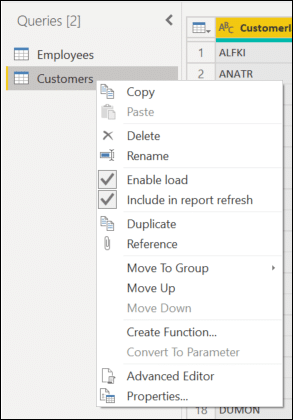
4. Data Preview Pane: 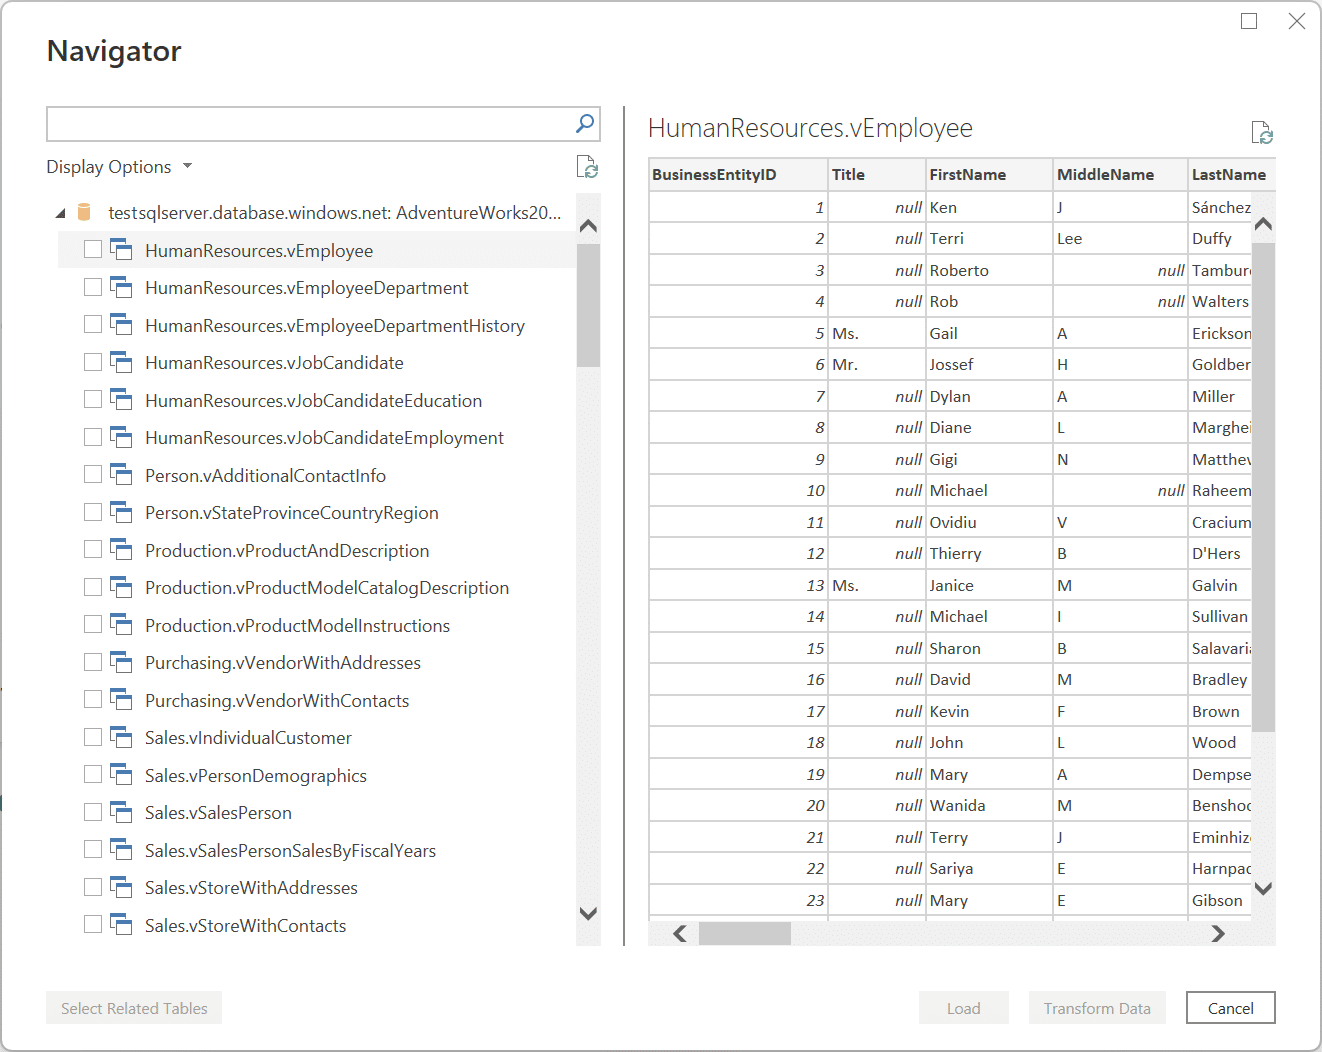
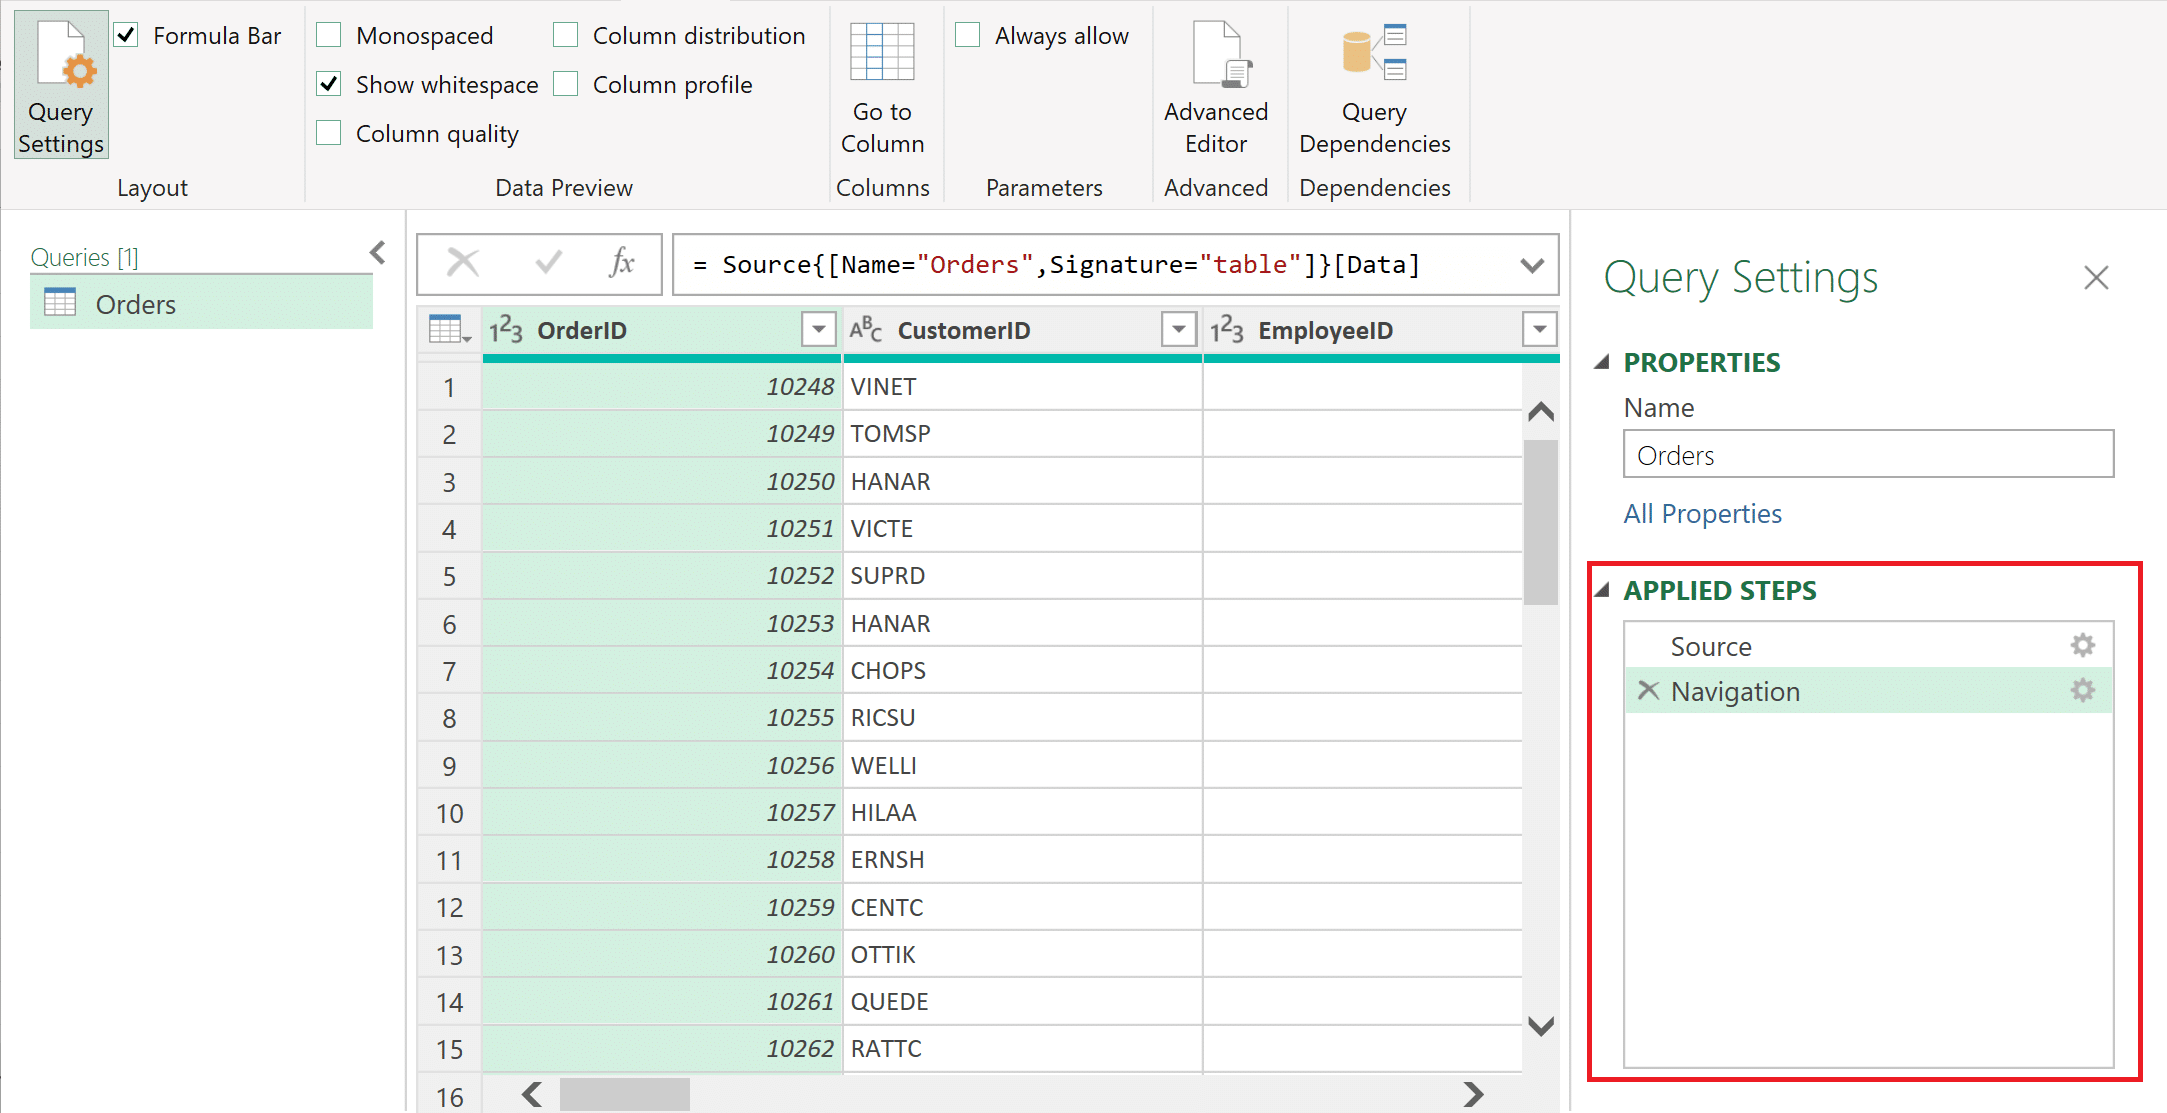
5. Applied Steps Pane:
Tracks and manages each step of your transformation process. You can edit, reorder, or delete individual steps. By understanding these components and their functionalities, you can easily navigate the Power Query interface and perform complex data transformations. With a strong understanding of Power Query’s interface, you’re now ready to dive into the heart of data transformation.
Transforming Data in Power Query
Power Query offers a wide range of powerful tools to transform your data. Let’s explore some of the essential techniques:
Splitting and Combining Columns
Split Column
Divide a single column into multiple columns based on a delimiter (e.g., comma, space, or custom delimiter). 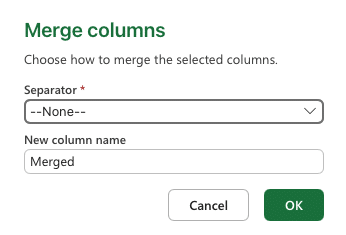
Filtering and Sorting Data
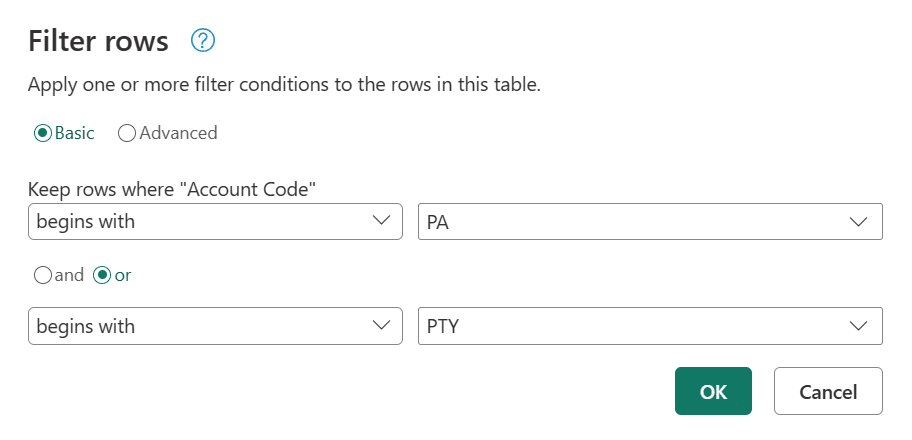
Filter Rows
Select specific rows based on conditions applied to one or more columns.
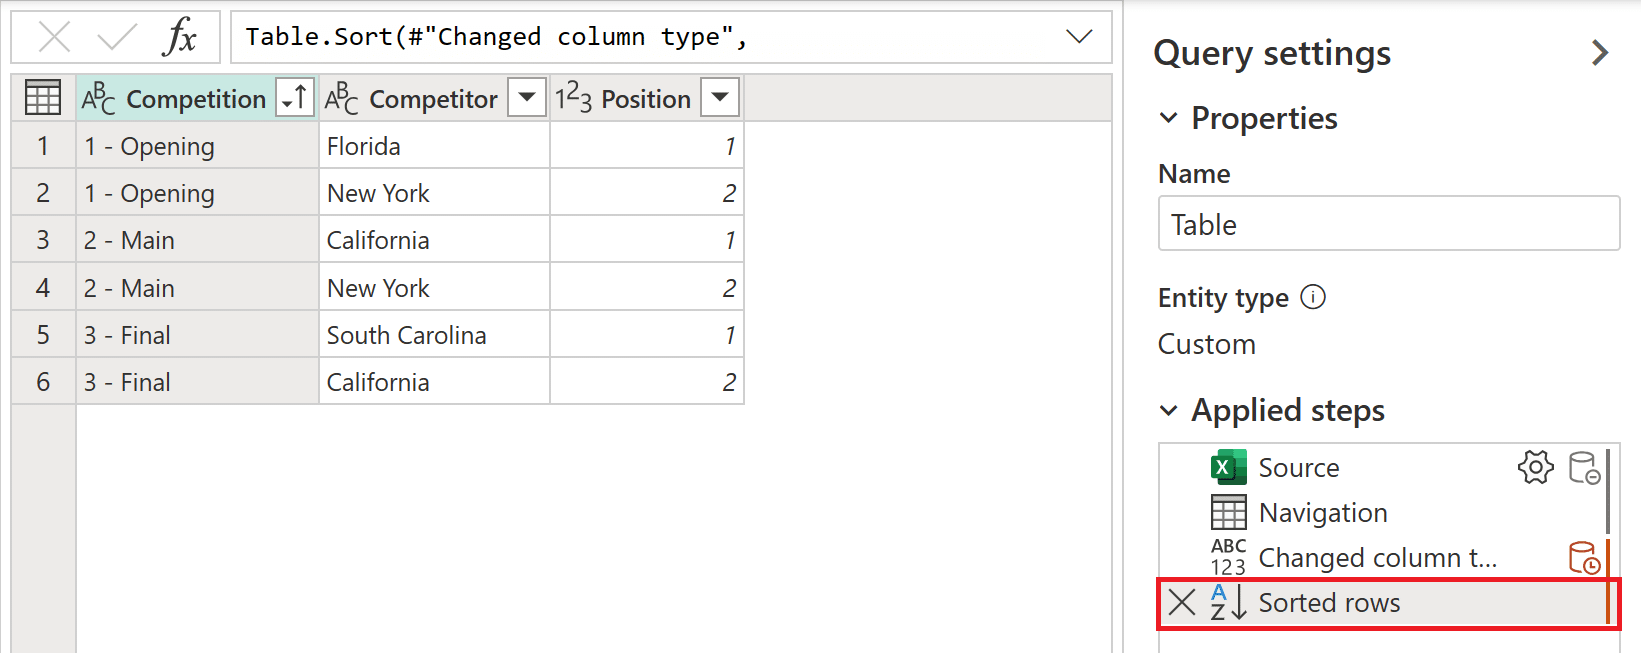
Sort Rows
Arrange rows in ascending or descending order based on one or more columns.
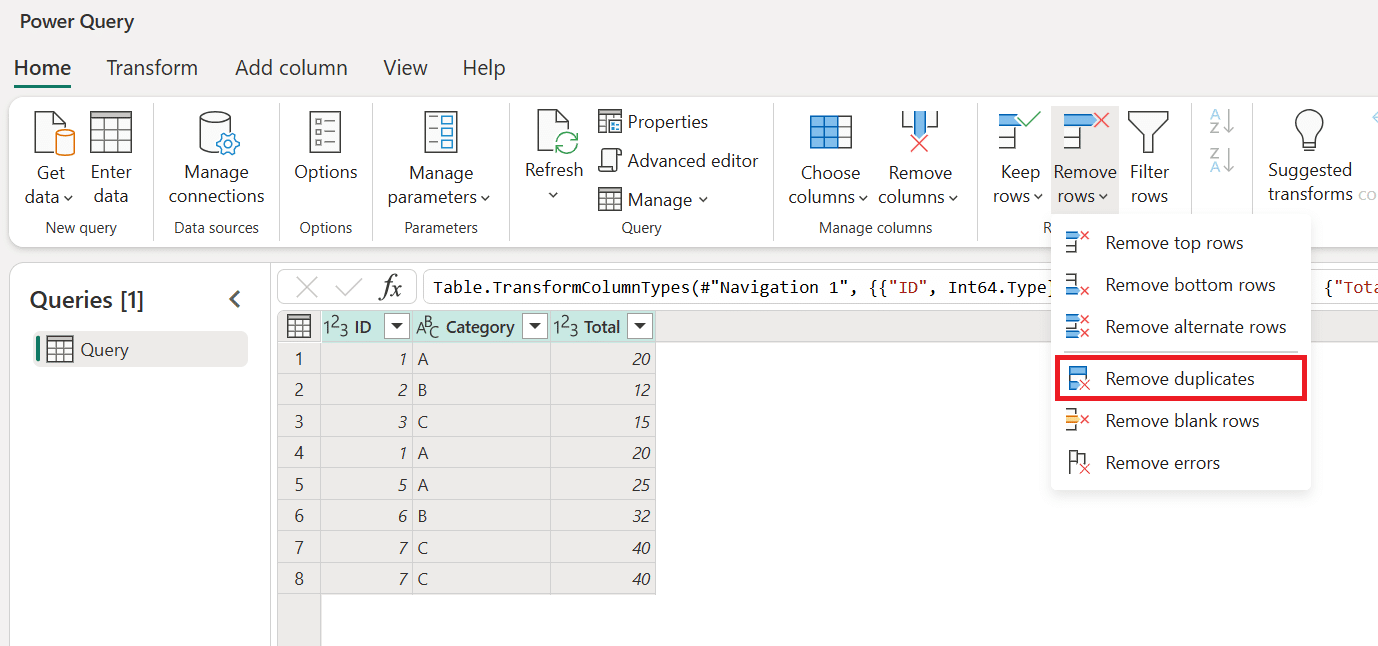
Removing Duplicates
Identify and eliminate duplicate rows, ensuring data accuracy and consistency.
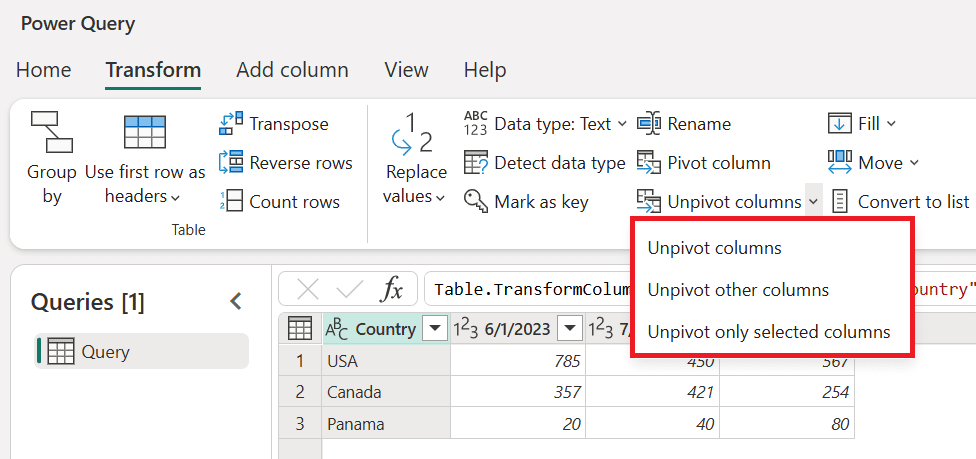
Pivoting and Unpivoting Data
Reshape your data from a row-based to a column-based format, useful for summarising data.
Convert column headers into rows, often used to normalise data.
Creating Conditional Columns and Custom Functions
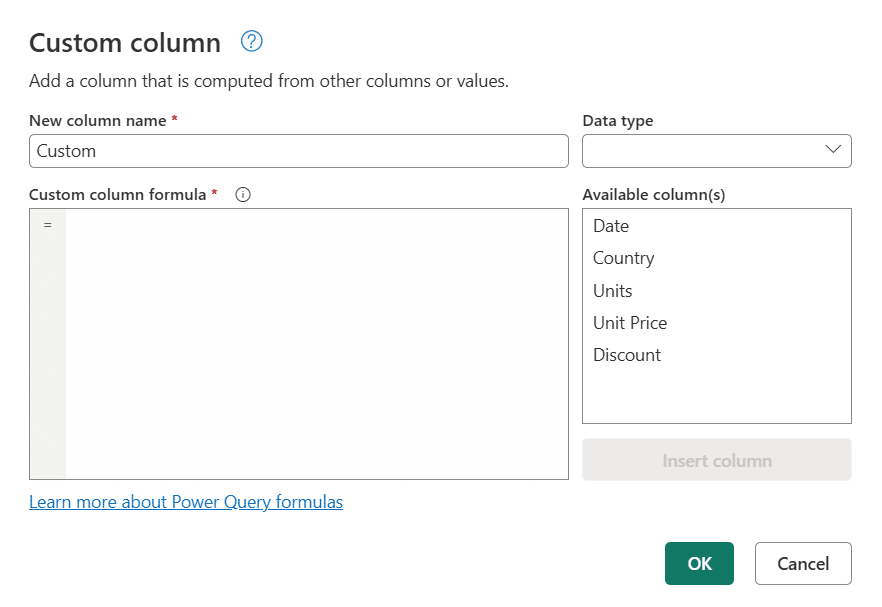
Add Custom Column
Create a new column based on a formula or expression, allowing you to perform calculations, text manipulations, and other transformations.
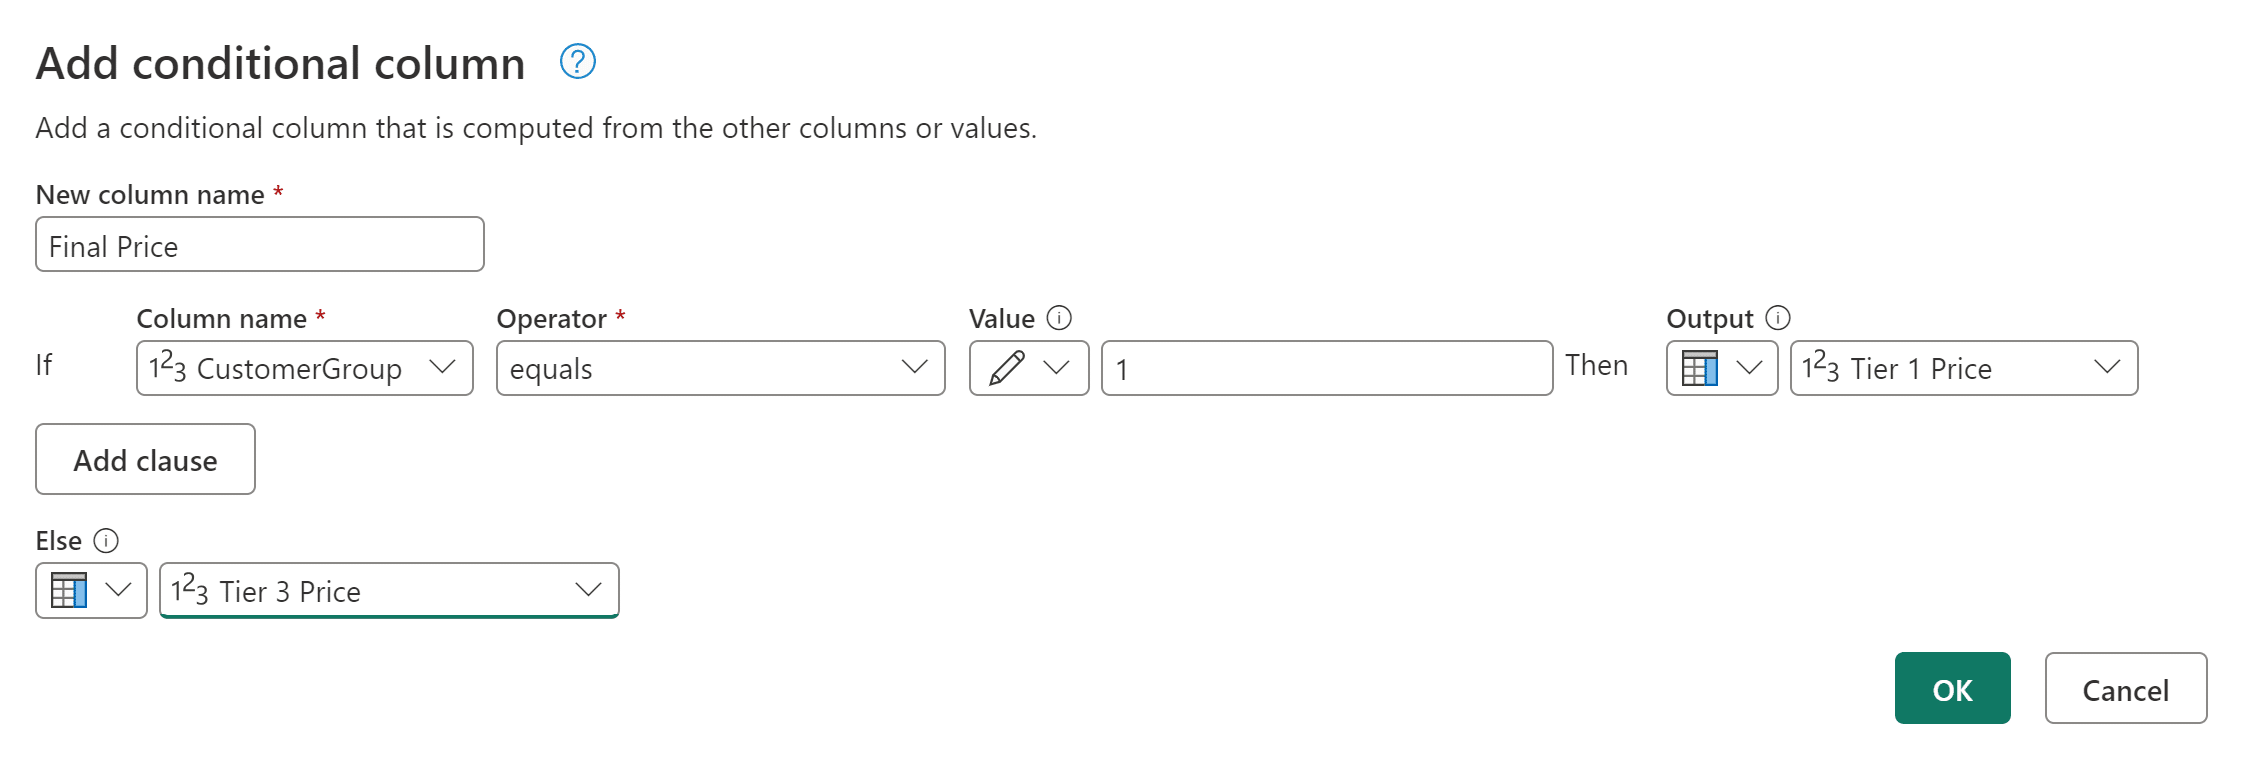
Generate a new column where values are assigned based on specific conditions.
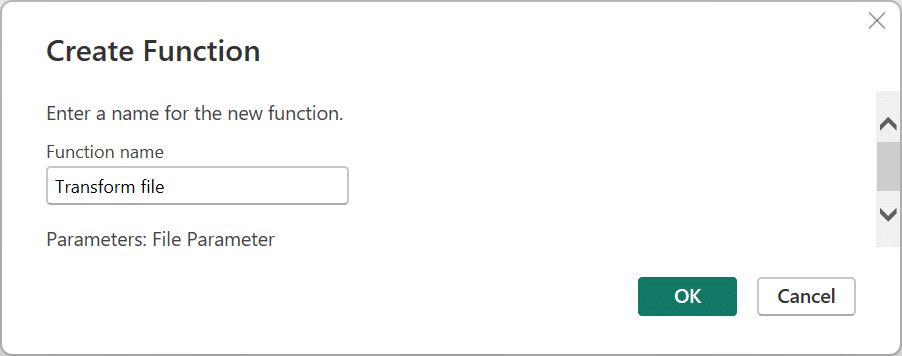
Define reusable functions to simplify complex transformations and promote code reusability. By mastering these techniques, you can effectively clean, shape, and manipulate your data to uncover valuable insights.
Wrapping Up
In this guide, we’ve explored the fundamentals of Power Query, from accessing and loading data to performing complex transformations. Power Query’s versatility and efficiency make it an indispensable tool for data analysts, business intelligence professionals, and anyone who works with data in Excel. As you continue to explore its capabilities, you’ll discover new ways to automate tasks, clean data, and derive meaningful insights. We encourage you to delve deeper into Power Query’s advanced features, such as creating custom functions, working with APIs, and integrating with other tools. Remember to experiment and explore the advanced features of Power Query to unlock its full potential. Happy data transforming!
Ready to Sharpen Your Data Analysis Skills?
Consider enrolling with @ASK Training’s Introduction to Microsoft Excel Power Query, Data Model, Power Pivot & DAX course! Whether you’re a beginner or an advanced user, we offer a range of Microsoft Excel courses to suit you and your team’s needs. From Excel basics to advanced techniques, our courses are designed to help you master data analysis and visualisation. Get in touch with us to know more!

