Many professionals start their data analytics journey with the same question: Should I learn Power BI or Python first?
It’s a reasonable question, after all, these tools are frequently listed in job descriptions and digital transformation initiatives.
What’s asked less often is a far more important question: Do I truly understand my data?
This is where Excel plays a critical role. Long before dashboards and automation, Excel teaches how data is structured, cleaned, analysed, and interpreted.
It develops the habits that strong analysts rely on, such as logical thinking, attention to detail, and the ability to explain insights clearly.
This is why Excel is important for data analytics, particularly for professionals building skills alongside work commitments.
Excel is not a stepping stone to be rushed through; it is the foundation that determines how effectively someone can learn Power BI and other analytics tools later on.
Learners who invest time in Excel typically find that advanced platforms feel more intuitive and far less overwhelming.
At @ASK Training, we see this pattern repeatedly. Learners who begin with Excel, through structured, subsidised programmes, gain confidence faster and apply analytics skills more effectively in their roles, making Excel the most practical starting point for a sustainable analytics career.
Let’s explore why Excel is the smartest first step in your data journey, and how it prepares you for everything that comes next.
Excel Is the Foundation of Data Analytics
Before you can build anything of substance, you need a strong foundation. In the world of data, that foundation is built in Excel.
While tools like Power BI and Python are celebrated for their power, they all rely on the same fundamental principles that Excel teaches in the most accessible way.
Excel is where you learn the essential grammar of data analytics. This foundational skillset includes:
- Data Structuring & Organisation: Learning to format data into clear, consistent tables; a prerequisite for any analysis.
- Core Functions & Logic: Using formulas like VLOOKUP and SUMIFS to transform and interrogate data, building critical logical thinking.
- Exploratory Data Analysis (EDA): Sorting, filtering, highlighting outliers, and critical data are part of the drill-down process.
- Summarisation & Visualisation: Creating PivotTables and charts to move from raw numbers to clear insights.
Mastering these in Excel ensures you understand the “why” behind the data process, preventing confusion when you encounter similar, automated steps in advanced tools.
But beyond specific skills, this process cultivates something even more valuable: a fundamental shift in how you approach information.
Excel Builds the Right Analytical Mindset
The real challenge in data analytics is not learning the software; it’s learning how to think with data.
While advanced tools can automate processes, they cannot automate insight. This is where Excel provides its most crucial lesson: it trains your analytical judgment.
Excel requires a structured, methodical approach. You don’t just get an answer; you build it step-by-step. You learn to question the data’s structure, trace the logic of your formulas, and validate your results.
This hands-on process develops a disciplined mindset essential for real-world analysis, where data is often messy, and assumptions must be checked.
Through daily practice, you cultivate this mindset by:
- Automating calculations with formulas, which reinforces logical sequencing and an obsession with accuracy.
- Identifying patterns and outliers using tools like conditional formatting, sharpening your eye for what matters in a dataset.
- Synthesising information by building PivotTables and charts, moving from raw numbers to clear, actionable summaries.
These tasks train you to ask better questions:
- What story is this data telling?
- Is this trend significant?
- What decision does this insight support?
Excel shifts your role from a passive processor to an active interrogator of data.
This foundational way of thinking, questioning inputs, validating logic, and translating numbers into narrative, is your most transferable skill.
When you progress to Power BI or Python, you are not starting over. You are applying the same analytical judgment within a more powerful environment.
The tools change, but the core discipline of thinking clearly with data remains, giving you the confidence to adapt and excel.
With this mindset in place, you possess a key that unlocks not just Excel, but every data tool that follows.
How Excel Skills Transfer to Power BI and Beyond
Learning Excel before a tool like Power BI is not a detour; it’s the most efficient path. The skills you develop don’t become obsolete; they evolve.
The transition is direct because the core concepts are identical:
- From Formulas to DAX: The logical reasoning for Excel functions is the same needed for Power BI’s DAX language.
- From PivotTables to Interactive Visuals: The process of analysing data with a PivotTable mirrors building reports in Power BI.
- From Manual Cleaning to Power Query: Understanding why data must be cleaned in Excel makes you proficient in using Power Query’s automation.
By starting with Excel, you learn the principles. When you move to Power BI, you can focus on leveraging its advanced capabilities rather than struggling with core concepts.
However, attempting this transition without the Excel foundation can lead to common and costly mistakes.
Common Mistakes when Skipping Excel
Skipping foundational Excel training to jump straight into advanced tools often leads to predictable roadblocks that can slow your progress and undermine confidence.
These pitfalls highlight exactly why the foundational step is so critical:
1. Struggling with Data Preparation
Without hands-on cleaning experience, simple issues like formatting inconsistencies become major obstacles in Power BI, wasting hours of debugging time.
2. Weak Grasp of Data Relationships
If you haven’t solidified how tables connect using Excel functions, the more abstract data model in Power BI can be confusing, leading to incorrect reports.
3. Reliance on Automation Without Insight
It’s possible to create dashboards without understanding the calculations behind them. Excel’s transparent environment fosters true data literacy, ensuring you control the tool and can explain your results.
The good news is that these mistakes are entirely avoidable with a structured and practical starting point.
How to Start Learning Excel for Data Analytics?
Starting your analytics journey with Excel is not about learning everything at once; it’s about building capability in the right sequence.
With focused, practical practice, Excel becomes a powerful training ground that prepares you directly for tools like Power BI. A clear, structured approach makes all the difference.
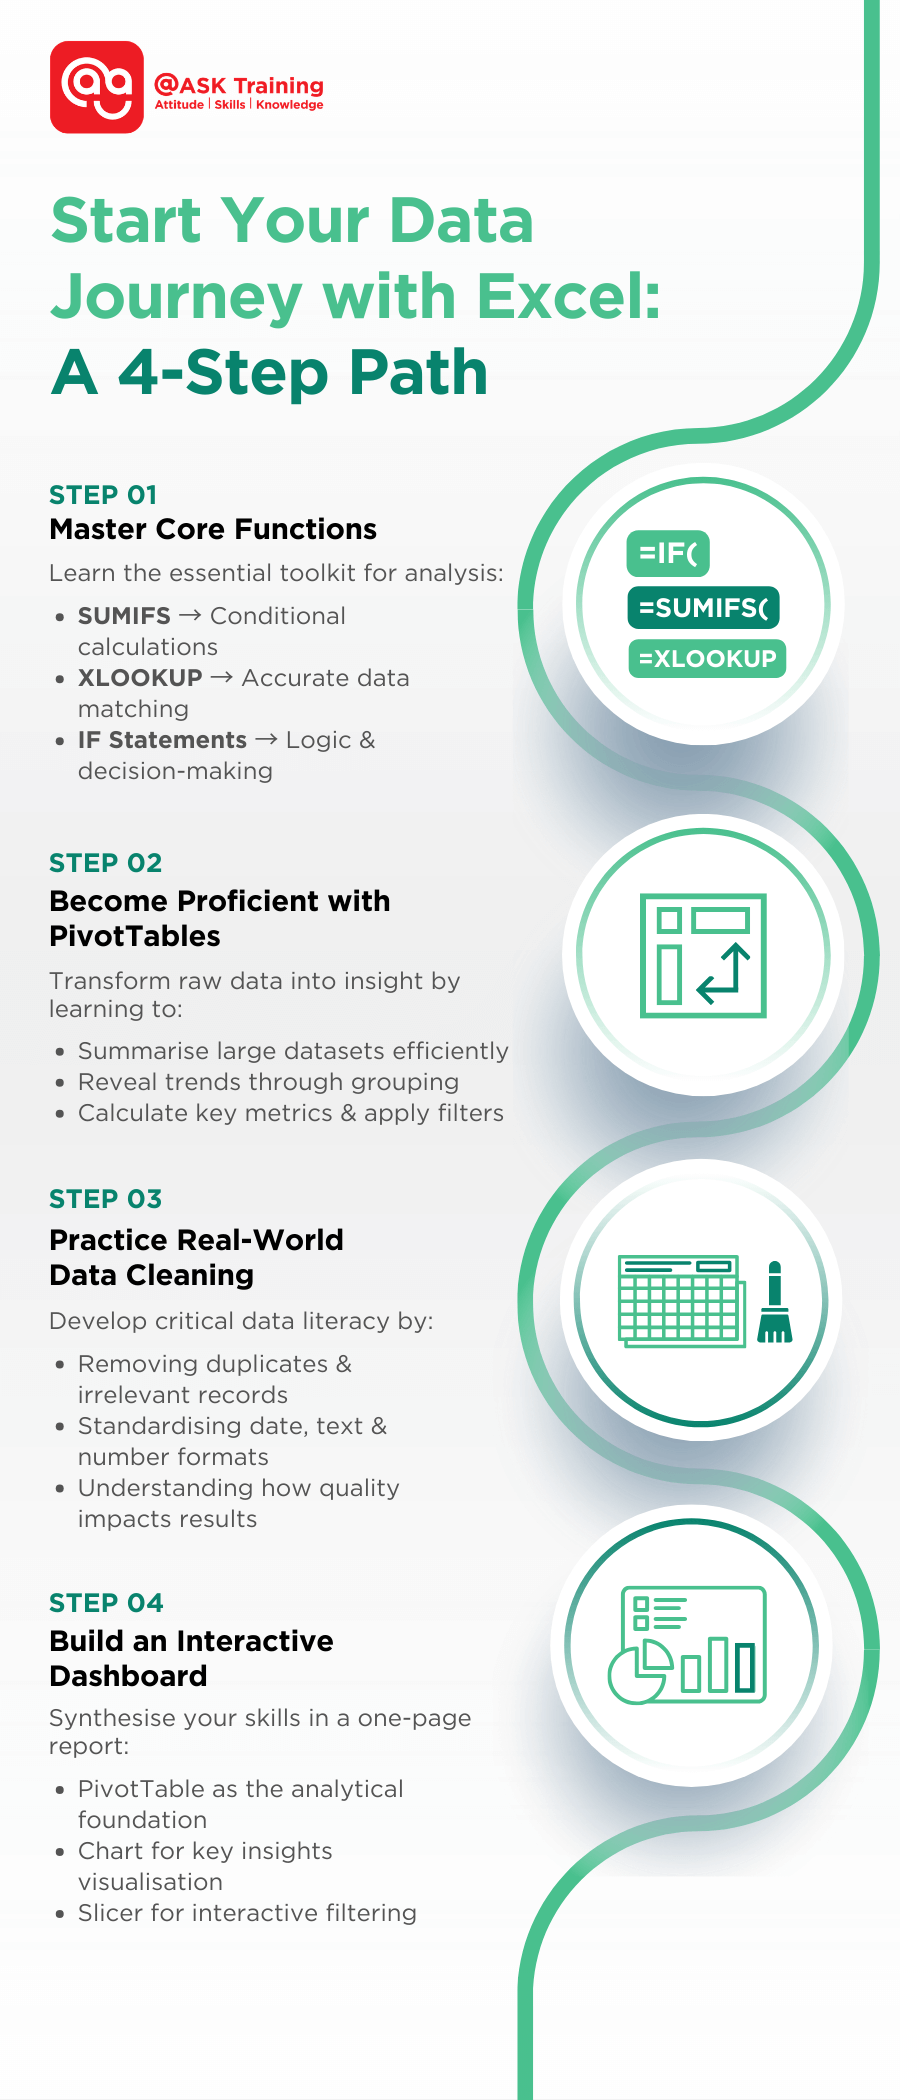
1. Build Your Core Analytical Toolkit
Focus on functions that form the backbone of data analysis:
- Apply SUMIFS to perform conditional calculations based on business rules
- Use XLOOKUP to retrieve and match data accurately across tables
- Build logic with IF statements to support decision-making and scenario analysis
- Develop the habit of translating real business questions into formulas
2. Develop Confidence with PivotTables
Practise turning raw data into structured insight by learning to:
- Summarise large datasets efficiently
- Group data to reveal trends and patterns
- Calculate key metrics such as totals, averages, and percentages
- Apply filters to answer specific business questions
3. Learn to Clean and Prepare Real-World Data
Strengthen data literacy by working with imperfect datasets and practising how to:
- Remove duplicates and irrelevant records
- Standardise formats for dates, text, and numbers
- Identify inconsistencies and potential errors
- Understand how data quality directly impacts analysis results
4. Create a Simple, Interactive Dashboard
Bring your skills together by building a one-page Excel report that includes:
- A PivotTable as the analytical foundation
- At least one chart to visualise key insights
- A slicer and timeline to enable interactive filtering
- A clear layout that mirrors dashboard workflows used in Power BI
If you’re the type of learner who prefers a guided and efficient path, a SkillsFuture-subsidised Excel course can accelerate progress significantly.
Providers such as @ASK Training offer structured programmes designed to help professionals move confidently from Excel fundamentals into applied data analysis, creating a clear, practical bridge to Power BI and broader data analytics initiatives.
Wrapping Up
As we’ve explored, Excel is far more than a spreadsheet application—it’s the essential training ground for anyone serious about a career in data analytics. To recap the crucial insights:
Three Core Reasons Excel is Indispensable:
- Foundation First: Excel teaches the fundamental grammar of data, from structuring, cleaning, to transformation, that every advanced tool assumes you already know
- Mindset Over Mechanics: Beyond formulas, Excel cultivates the analytical thinking, problem-solving discipline, and data intuition that separate true analysts from button-pushers
- Strategic Progression: Your Excel skills don’t become obsolete; they transform directly into Power BI proficiency, making your learning curve significantly smoother
Here’s a recap on starting your Excel journey:
Remember: In an era of rapidly evolving technology, the most future-proof skill isn’t knowledge of any single tool; it’s the fundamental ability to think critically with data. Excel remains the most effective, accessible environment to develop this capability.
Start where data starts. Build your foundation with purpose, and you’ll find that every subsequent step in your analytics journey becomes clearer, more confident, and more impactful!
Ready to Build Your Data Foundation?
Consider us as your ally in your data-driven learning journey! Explore practical, structured learning paths with @ASK Training’s range of Microsoft Excel for Data Analytics courses.
Our Excel courses are designed to take you from beginner to analyst with clarity and confidence.
Here are some of our popular Excel courses:
- Introduction to Microsoft Excel Power Query, Data Model, Power Pivot & DAX
- Bridging Big Data Analytics using Excel & Power BI
- Professional Certificate in Business Analytics & Statistics with Excel
Speak to our learning consultant and take the first decisive step today!